Download
1 / 19
190 likes | 368 Vues
Direct Observation of Non-Brownian Protein Diffusion in Cytoplasmic Membrane Using Single Particle Tracking Method. MIYASAKA Lab. Takashi Sugiyama. Introduction. MSD. 0. t. MSD. 0. t. MSD∝t. Homogeneous solution. MSD: M ean- s quare d isplacement. Normal diffusion.

E N D
Direct Observation of Non-Brownian Protein Diffusion in Cytoplasmic Membrane Using Single Particle Tracking Method MIYASAKA Lab. Takashi Sugiyama
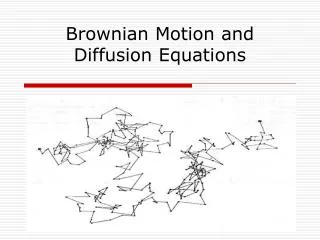
Introduction MSD 0 t MSD 0 t MSD∝t Homogeneous solution MSD: Mean-square displacement Normal diffusion Molecules undergo Brownian motion. MSD∝t Heterogeneous media Anomalous diffusion Hierarchical dependence ・extracellular matrices (e.g. hyaluronan) ・cytoplasmic membrane ・cellular cytoplasm Molecules undergo hierarchicalmotion.
Recent high time- and space-resolved optical detection technique enables us to observe directly anomalous diffusion in heterogeneous media, such as extracellular matrices and cytoplasmic membrane. • Transmembrane proteins undergo thermal motion in plasma membrane. • The membrane is compartmented by membrane skeleton. Elucidation of anomalous diffusion of proteins in plasma membrane <Experimentally> Single Particle Tracking (SPT) method <Numerically> Monte Carlo simulation Kusumi et al., Biophys.J.88, 2266-2277 (2005).
High speed video camera Camera controller TV monitor Digital image processor Digital video recorder Hg lamp Experiment 1 Single Particle Tracking (SPT) A protein connected with a colloidal gold particle is tracked with high-speed video camera. 40-nm colloidal gold particle Transferrin Transferrin receptor Frame time (exposure time) > 25 ms Sample: transferrin receptor incorporating with transferrin labeled by 40 nm-gold particle in PtK2 cells
Experimental results Trajectory of gold particles Brownian motion (Normal Diffusion) Non-Brownian motion (Hop Diffusion) D = 0.34 ± 0.03 m2/s D = 2.2 ± 0.2 m2/s Averaged compartment size ~ 47 nm
Apparent diffusion coefficient Sort of diffusion Frame time No remarkable change compared to diffusion in homogeneous media 33 ms 0.34 ± 0.03 m2/s Normal Diffusion Trajectory was compartmentalized 2.2 ± 0.2 m2/s Hop Diffusion 25 s Frame time (exposure time) of the high-speed video camera affected the apparent trajectory of the protein, which can lead to an erroneous conclusion. Numerical approach to elucidate the artifact Monte-Carlo simulation of the microscopic image capturing with 1 s time resolution
Simulation 1 Simulations are performed for 3 conditions. a) Simple brownian motion no barriers to motion b) Confined motion ・confined in square lattice ・in lattice, free brownian motion {square size; 42 nm, 120 nm, 240 nm} c) Hop diffusion ・2D-square array of partially permeable barriers (transmission 0.0008) ・compartment size 120 nm
100 runs, each run includes 1000 frames. Time step : 1 ms Diffusion coefficient (set value): 9 mm2/s ( = (6 nm)2/4/1 s) Particle is represented by Gaussian intensity profile with a width of 250 nm. Simulated CCD images Simulated motion of the proteins A CCD pixel corresponds to 40 nm square in focal plane Frame time: 10 s Frame time: 100 s Pixel 6 nm 40 nm
Nth frame First frame Kernel of first frame ・・・ ・・・ cross correlation image Center of mass Resolution can be changed from 40 nm (pixel resolution) to 10 nm approximately. Diffusion coefficient can be calculated.
Simulation results Simulation results a-1 a) Simple Brownian motion MSD-t plot ( for 25 ms, 33 ms)
Simulation results a-2 Observed diffusion coefficients are the same as set value 9 mm2/s. Observed apparent diffusion coefficient D2-4 was calculated from 2nd, 3rd and 4th frames by linear fit of MSD-t plot (1st is the kernel). Apparent diffusion coefficient was independent of the frame time
Simulation results b-1 b) Confined motion <Trajectories> Simulation results position (nm) Increasing frame time (exposure time), the motion erroneously appeared as if it had stopped at central position.
Simulation results b-2 ○MSD-t plot (size 120 nm; for 25 ms, 33 ms) ○Observed apparent diffusion coefficient 25 ms~33 ms Owing to frame time, apparent diffusion coefficient fell down erroneously.
Simulation results c-1 c) Hop diffusion (compartment size 120 nm) median residency time: 23 ms Simulation results Frame time <23 ms Frame time >23 ms
Simulation results c-2 ○MSD-t plot ( for 25 ms, 33 ms) Hierarchical dependence no hierarchy ○Observed apparent diffusion coefficient 25 ms~33 ms Diffusion coefficient has hierarchical dependence on frame time
Simulation results c-3 (= frame time) Frame time ② ① ③ a; anomalous parameter log(MSD/t)=(a-1)log(t)+C’ a=1, diffusion is normal, and log(MSD/t) is constant ①&③ a<1, diffusion is anomalous, and log(MSD/t) decreases with passing the time ② In 10-4~2×10⁻²(s) time region, anomalous diffusion affected by inpermeable barriers is observed.
In this time range, observed diffusion is anomalous. discussion ・Simple Brownian motion ① 10-4 ・10-4 (s) is equal to time for diffusing 60 nm (half size of compartment length). s t = L2/4DMacro 10-3 s 60 nm ② 120 nm Compartment 10-2 s ・2×10⁻²(s) is close to median residency time 23ms. 10-1 ③ ・Observed diffusion appeared to be simple but slow Brownian motion. s
Apparent diffusion coefficient Simulation Experiment Simulation condition ・hop diffusion ・compartment size 54 nm ・transmission probability 0.0045 Simulation results are in good agreement with the experimental results
Summary Dependence of frame time and total observation time on apparent diffusion behavior of the membrane proteins was investigated using the SPT method and Monte Carlo simulations. Experimental results The apparent diffusion coefficient of transferrin receptor in cell membrane decreased with increasing frame time. The compartment size of the membrane in PtK2 cells was determined to be ~ 47 nm using the SPT method. Simulation results (1) Molecules in membrane without skeleton exhibited simple Brownian motion independent of the frame time. (2) In the case of confined diffusion, the motion of proteins erroneously appeared as if it had stopped at central position with an increase in frame time (exposure time). (3) Hierarchical diffusion was observed in the simulation of hop diffusion. The simulation results reproduced the experimental result well.