Correlation of Fish Stock Biomass and Larval Density
Explore correlations between larval density and spawning stock biomass for Middle Atlantic Bight fish species to predict stock sizes. Findings and implications for fisheries management.

Correlation of Fish Stock Biomass and Larval Density
E N D
Presentation Transcript
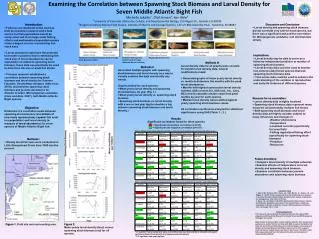
Michelle Jakaitis†, Olaf Jensen‡, Ken Able‡ †University of Colorado, Molecular, Cellular, and Developmental Biology, 150 Regent Dr., Boulder, CO 80309 ‡Rutgers University Marine Field Station, Institute of Marine and Coastal Sciences, 132 c/o 800 Great Bay Blvd., Tuckerton, NJ 08087 • Introduction • Fisheries are important to the world as both an economic resource and a food source, but fish populations cannot be easily observed. Even large-scale fishing efforts and mathematical population models retain a degree of error in predicting fish stock sizes. • Larval abundance data have the potential to become a powerful tool in estimating fish stock size; if larval abundances can be repeatedly correlated to spawning stock biomass, these data can potentially be used to determine the size of adult fish stocks. • Previous research established a correlation between spawning stock biomass and larval density for Summer Flounder, Paralichthys dentatus (Able et al., 2010), and between spawning stock biomass and juvenile abundance for Atlantic Croaker, Micropogonias undulatus (Hare and Able, 2007); both Middle Atlantic Bight species. • Discussion and Conclusion • Larval density and spawning stock biomass did not correlate very well for most species, but there was a significant and positive correlation for Micropogonias undulatus and Centropristis striata. • Implications: • Larval density may be able to serve as a fisheries-independent predictor or monitor of spawning stock biomass. • Larval density data could be used to monitor non-commercially fished species that lack spawning stock biomass data. • Time series data could be used to enhance the understanding of the variation in reproduction and early life histories of different species. Northern fish (species spawn north of Cape Cod, Massachusetts.) Southern fish (species spawn south of Cape Hatteras, North Carolina.) Regionally diverse fish. • Methods III • Larval density data for all graphs quite variable. • To smooth larval density data, several modifications made: • Generated graphs of mean yearly larval density vs. month to determine the months with the peak larval abundances. • Months with highest consecutive larval density isolated, SAS (version 9.2, SAS Inst., Inc., Cary, NC) used to calculate median value from peak months by year for each species. • Median larval density values plotted against yearly spawning stock biomass values. • All correlation coefficients analyzed for statistical significance using SAS (Table 1., 2.) • Methods II • Generated multiple graphs with spawning stock biomass and larval density as a way to visually examine the data and identify any trends. • Graphs plotted for each species: • Mean yearly larval density and spawning stock biomass, by year (Fig. 1.) • Mean yearly larval density vs. spawning stock biomass. • Spawning stock biomass vs. larval density with a one or two year lag (to simulate a lag between spawning stock biomass and larval density.) Examining the Correlation between Spawning Stock Biomass and Larval Density for Seven Middle Atlantic Bight Fish • Reasons for no correlation: • Larval density data is highly localized. • Spawning stock biomass data represent many estuaries and potentially multiple fish stocks. • Both spawning stock biomass and larval density data are highly variable; subject to many influences and changes in: • -Weather phenomena • -Temperature • -Localized currents (specifically for larval fish) • -Fishing regulations/fishing effort (specifically for spawning stock biomass) • -Predation • -Resources Objective Determine if a correlation exists between spawning stock biomass (an estimate of how many reproductively capable fish exist in a population) and larval density (a measure of larval abundance) for seven species of Middle Atlantic Bight fish. Results Significant correlation found for three species = Significant and positive correlation (p<0.05) = Significant and negative correlation (p<0.05) Table 1. Mean yearly spawning stock biomass versus larval density for all species, with offset years. • Methods I • Weekly larval fish tows were conducted in Little Sheepshead Creek from 1989 into the present. • Future directions: • Compare larval density of multiple estuaries. • Examine effects of temperature on larval density and spawning stock biomass. • Examine correlation between juvenile abundance and spawning stock biomass. Table 2. Median yearly spawning stock biomass versus larval density for all species, with offset years. Literature Cited 1. Able, K.W., Sullivan, M.C., Hare, J.A., Bath-Martin, G., Taylor, J.C., and Hagan, R. (2010) Fishery independent larval monitoring as a measure of summer flounder (Paralichthys dentatus) stock status: implications for management. Fish. Bull. (In Press). 2. Hare, J.A., and Able, K.W. (2007) Mechanistic links between climate and fisheries along the east coast of the United States: explaining population outbursts of Atlantic croaker (Micropogonias undulates.)Fish. Oceanogr. 16:1, 31-45. Acknowledgements This research was funded by the National Science Foundation REU program and through the Research in Ocean Sciences (RIOS) program at Rutgers University. Many thanks to mentors Olaf Jensen and Ken Able for their support and guidance, to Jackie Toth for her help with SAS, to Jamie Caridad for her help with larval fish identification, and to all the Rutgers University and Rutgers University Marine Field Station personnel for their support. Adult Cynoscion regalis image courtesy of Jay Turnure. All other adult fish images obtained from the National Oceanic and Atmospheric Administration (NOAA). Figure 1. Field site and surrounding area. Figure 2. Mean yearly larval density (blue) versus spawning stock biomass (red) for all species. *t-1 signifies that larval density data were shifted one year backwards to simulate a one-year lag time between larval density and spawning stock biomass. **t-2 signifies a two-year lag time. .