Page 6 / Fig 1
200 likes | 513 Vues
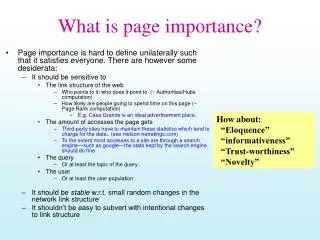
3. Storage. 2. Transfer. 4 . Delivery Receipt. 1. Ship-to-Shore. Figure : The Container Terminal Subsystems (Source: permission from Justin Nortillo, Maher Terminals Logistic Systems, Inc., US). Page 6 / Fig 1. Port 1. Port A. Port B. Port 2. Port C. Port 3. Port D. Port 4.

Page 6 / Fig 1
E N D
Presentation Transcript
3. Storage 2. Transfer 4. Delivery Receipt 1. Ship-to-Shore Figure : The Container Terminal Subsystems (Source: permission from Justin Nortillo, Maher Terminals Logistic Systems, Inc., US) Page 6 / Fig 1
Port 1 Port A Port B Port 2 Port C Port 3 Port D Port 4 Page 8 / Fig 2
Port 1 Port A FEEDER SERVICES FEEDER SERVICES Port B Port 2 MAIN LINE SERVICE Port C FEEDER SERVICES Port 3 Port D FEEDER SERVICES Port 4 De Monie International Port Consulting Page 9 / Fig 3
CT subsystems Decision Types Time Frame Typical Issues Terminal location, Terminal size, and resource type Allocation of resources, size of workforce, and “rules of thumb” Daily scheduling of jobs, process management, scheduling of workers Strategic Ship-to-Shore Planning Storage Tactical Controlling Transfer Operational Delivery/Receipt Page 34 / Fig 7
Central or regional government Economic/ commercial port community Customs Container terminal community Legal firms CT operator Inland Transport operator Port Authority Ship Agent Public authorities Stevedore Banks Shipping line/ alliance Shippers Freight Forwarders Page 107 /Fig 2
3. Storage 1. Ship-to- Shore 4.Deliver- Receipt 2.Transfer Containers Containers Page 131 / Fig 1
S S SC SC SC Management System Simulator Terminal Manager Stevedore Stevedore Stevedore Port Captain Ship Captain Ship Captain Ship Captain observations actions CT Simulator cran crane Cranes Cranes Cranes crane crane Page 153 / Fig 1
<<agent>> Ship(S) <<agent>> SC(s) <<agent>> Port Captain <<agent>> Stevedore(s) <<agent>> Terminal Manager -Crane Properties -Quay Properties -Assigned SCs -Sequence Policy -Ship Properties Manifest -# Containers Out -# Containers In -Container Types -Container Dest. -Shifting Factor -Est. Arrival time -Est. Depart time -Crane Properties -Quay Properties -Pre-Berth Spot Allocation -Crane Properties -Crane Cost -Berth Schedule (dynamic) -Crane Availability -Berth Policy -SC properties -Stack Positions <<agent>> Crane(s) <# Containers out> <# Containers in> <ETA> Sequencing Create Ship <slot> Service Time Calculation Ship Request <Ship Properties> <Desired Serv. Time> <Manifest> Crane Needs Calculation Crane Request <Desired Serv. Time> <Avg. #of Cranes Needed> <Ship Properties> <Manifest> Berth Allocation Crane Allocation Berth & Crane Assignment <cranes assigned> Berth Assignment <Berth Position> Bay Allocation Bay Plan (of Ship) <# Containers Out> <# Containers In> <Berth Positions of Bays in ship> <# Containers in Bay> <Container Properties> Call SC agents SC agent assigned Crane Request(s) SC agent States Operations Completed Ship Un/loading Completed Free Berth & Cranes Ship ‘Departs’ Page 154 / Fig 2
Tactical/Strategic Decisions Sequencing Policy: - First In First Out - Highest Earnings First - Shortest Job First Positioning Policy: - Berth Closest to the Stack - Overall Time Shortening Stacking Policy: - Stack by Line - Stack by Destination Berth Allocation Stack Allocation Processes in Transhipment of Containers Ship Arrival Load and Unloading Horizontal Transport Yard Stack/ Stack on Quay Operational Decisions QC Allocation SC Allocation Goals: - Efficient use of equipment - Reduce Distance Traveled - Service Ship’s Containers - Fast Turn-Around Time - Low Costs for Serving Ships Page 170 / Fig 1
Yard Stacks with Yard Cranes (areas for storing containers) 3 4 Yard Stacks with Yard Cranes (areas for storing containers) Page 211 / Fig 4 & 5
Government Legal Authorities Economic/commercial port community Central or Regional government Container terminal community Terminal operator Inland Transport operator Customs Shipping line Shippers Public authorities Freight Forwarders Sweden Information Transport Corridor Klaipeda Karlshamn Denmark Lithuania Poland Germany Page 238 / Fig 1
MAS Input or Data Level 1 • d Transport Demands Level 2 Assignment of Decision Weights by Each Agent Transport Costs send send Level 3 update update Transaction Costs Freight Forwarders Shipper Shippers (d) Inland Tranport providers Terminals Ship Lines Government legal Authorities Government legal Authorities Terminal Historical cooperation behaviour Policy Rules (Subsidize or Tax) Influences the Environment Profit Preference of Cooperation Feedback DCR Algorithm Resulting Governing Structures: contract vertical market αi Page 244 / Fig 2