Probabilistic Reasoning for Modeling Unreliable Data
Probabilistic Reasoning for Modeling Unreliable Data . Ron Tal York University. Agenda. Modeling Uncertainty Bayesian Reasoning M-Estimation Maximum Likelihood Common Pitfall More Advanced Models . Modeling Uncertainty. Why is it necessary?

Probabilistic Reasoning for Modeling Unreliable Data
E N D
Presentation Transcript
Probabilistic Reasoning for Modeling Unreliable Data Ron Tal York University
Agenda • Modeling Uncertainty • Bayesian Reasoning • M-Estimation • Maximum Likelihood • Common Pitfall • More Advanced Models
Modeling Uncertainty • Why is it necessary? • The only certainty in this world is uncertainty • Often we cannot afford or are not capable of explicitly enumerating all variables absolutely • Sometimes uncertainty is caused by a limit of the reliability of the technology • Making decisions with unreliable data
Modeling Uncertainty (cont.) • Three competing paradigms: • Non-monotonous Calculus • Fuzzy Logic • Probability Theory • Since we cannot construct a deterministic solution to many problems, we model sources of uncertainty as probability distributions
Bayesian Reasoning • At the core of probabilistic frameworks is Bayesian Inference • Let’s define a few concepts: • - The probability of witnessing evidence E given a hypothesis H • - The probability of hypothesis H given the evidence E • - Probability of Hprior to observing E • -
Bayesian Reasoning: Bayes’ theorem • States that: • Our life becomes simpler Expressed in terms of our model We usually know! We don’t always care! What we want to maximize
Bayesian Reasoning: Bayes’ theorem • If we prefer, it can also be written as The joint probability
M-Estimation Bayesian Inference gives us a powerful tool to choose the hypothesis that models the data A simple example is the set of parameters of a line of best fit through noisy data Statistical tools to achieve this are called M-Estimators The most popular choice is a special case called “Maximum Likelihood Estimator”
Maximum Likelihood Recall Bayes’ theorem: The denominator is merely a normalization constant Maximum Likelihood can be applied if we assume the model prior is known
Maximum Likelihood (cont.) • When model prior is constant: • Thus, we can fit model parameters by maximizing the likelihood
Maximum Likelihood (cont.) • To determine parameters of a model, we maximize the negative log likelihood: • This let’s us avoid playing with products
Maximum Likelihood (cont.) • For Gaussian distribution this is especially convenient:
Maximum Likelihood • Becoming: Least Squares Constant
Common Pitfall • We love Gaussian Distributions • We love Least-Squares • However, using Least-Squares without the process of probabilistic reasoning is a common rookie mistake
Better Modeling • Many statistical tools are available for when the Gaussian assumption fails • Assumptions can include • Good Data is Gaussian, Outliers are present • pdf can be represented as a mixture of causes • No parametric model is best suited for the job
Robust Statistics In Robust M-Estimators it is assumed that the data is locally Gaussian but outliers make traditional Least-Squares unsuitable Essentially, we give ‘bad’ data more credibility than it deserves Robust formulation ‘weighs’ the data with a Robust Influence Function
Robust Statistics (cont.) E.g. Tukey’s Biweight:
Mixture Models • Data can be represented as caused by one of several possible causes • Essentially a weighted sum of distributions • GMM is extremely powerful • EM Clustering is the ideal estimator for that
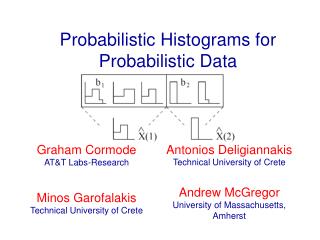
Non-parametric Actual observed data is used in place of a fitted model Usually a histogram To find the ML fit between new observed data and the histogram we can minimize the Bhattachariyya Distance:
Non-parametric Very simple to use Sometimes most accurate Very inefficient for problems with high dimensionality