spring
1. INTRODUCTION AND OBJECTIVES. 5 . HORIZONTAL VARIABILITY OF ICE AND FIRN LAYERS: GRID ANALYSIS.

spring
E N D
Presentation Transcript
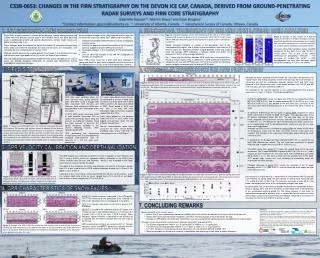
1. INTRODUCTION AND OBJECTIVES 5. HORIZONTAL VARIABILITY OF ICE AND FIRN LAYERS: GRID ANALYSIS Figure 4: Standard deviation of the GPR reflectivity of the 100 m X 200 m grids between 0.04 m and 8 m depth at a 0.2 m-interval for Site 2, HB 13-7, HB 9-1 and HB 4-7. GPR reflectivity were given a value from 0 to 1 based on their color (black = 0, white=1). Spatial horizontal variability is smaller in the percolation than in the superimposed ice region, and is larger at layer boundaries and when firn is present within ice. Standard deviation ranged between 0.020 and 0.083; since the average GPR reflectivity is between 0.832 and 0.980, this represents 2.0-10% of the average reflectivity. Fig. 1 shows that the distance between GPR tracks does not exceed 65 m. Based on results shown in Fig. 4, differences in GPR profile derived from the comparison of multi-year GPR transects will not be caused by the horizontal spatial variability associated with the different GPR tracks. Since 2005, a rapid increase in summer air temperature, surface energy balance and surface melt over glaciers and ice caps in the Canadian Arctic has been observed using a combination of field and satellite observations, climate model results and global reanalysis data [1-3]. These changes have the potential to impact the amount of refreezing of percolating water, which can affect the distribution of snow and ice facies,firnstratigraphy, and ultimately the rate and distribution of surface runoff. Although satellite data can be used to quantify the changes in the distribution of snow and ice faciesover large bodies of ice [4], results are often of low-resolution. The use of ground-based instruments to determine the spatial variability of firn and ice layers can provide important information to validate and complement current knowledge of snow facies changes. • We investigated changes in the subsurface ice and firn layers on the Devon Ice Cap since spring 2007, addressing 4 key points: • Calibrate and validate GPR-inferred ice and firnstratigraphyusing firncores. • Quantify the degree of horizontal variability in the firn and ice layers to support multi-year GPR survey analysis. • Investigate changes in thestratigraphy of the accumulation zone. • Link the observed changes in ice and firn stratigraphy to changes air temperature. • Note: GPR survey results for a given year were collected in spring and show the over winter snowpack and the structure of the underlying firn as it was at the end of the previous summer. Figure 5: Example of slice images at 4 different depths for site HB 13-7. A Hilbert transform envelope, amplitude equalization and migration were applied. Red and white represents firn, and blue represents ice. Greater spatial variability is associated with firn. Ice layers show little horizontal spatial variability compared to the 0.8-1.0 firn and 5.7-5.9 m firn/ice layers. This is due to the uneven refreezing of percolating meltwater. The presence of residual firn within a thick homogeneous ice layer also increases spatial horizontal variability (1-4.75 m, not shown). 2. FIELD SITE AND DATA 6. CHANGES IN SUBSURFACE ICE AND FIRN LAYERS GPS spring • Although the recent warming over the Devon Ice Cap affects the dynamics and surface mass and energy balances of the entire ice cap, the main changes in subsurface ice and firn stratigraphy between springs 2007 and 2012 were observed in the accumulation area, in the region between sites HB 9-1 and MB 15-9; the focus area was extended to MB 5-9. • The evolution of the upward migration of the superimposed ice (SI) and wet snow zones is shown in Figures 7-8 and described below. • During the spring 2007 survey, the upper-limit of the SI was located just below MB 15-9 (1430 m a.s.l.), and the region between MB 12-6 (1520 m a.s.l.) and MB 15-9 (1435 m a.s.l.) was defined as the wet snow zone. Ice layers in the wet snow zone were formed during (or at the end of) the warm summer of 2005. • A significant thickening of the ice layers in spring 2009 compared to spring 2007 is observed in the MB 12-6/MB 15-9 region. The upper-boundary of the SI remains unchanged, below MB 15-9. The wet snow zone, on the other hand, migrated 3 km up the main transect, from MB 12-6, to just below HB 9-1 (1600 m a.s.l.). The bottom ice layer formed during the 2005 summer acts as an impermeable layer for percolating water, explaining why the ice layer does not extend deeper. • Although no GPR survey is available for spring 2008, the record of JJA mean air temperature shows that the 2007 and 2008 summers were warm; this suggests that changes in the subsurface stratigraphy began during the warm summer of 2007. • In spring 2010, the SI upper boundary migrated to MB 15-9, as seen by the ice layer now reaching the surface. The wet snow zone continued its upward migration and its upper limit was at HB 9-1 (1610 m a.s.l.). • The GPR survey from spring 2011shows the second main shift in ice layer distribution. The SI upper boundary migrated to MB 12-6 (1520 m a.s.l.), and a second ice layer formed in the wet snow zone, now extending to just below MB 8 (1640 m a.s.l.). The 2010 summer was the warmest year of the 2006-2011 period. High surface melt and refreezing of percolating water are responsible for these changes. • Changes observed in spring 2012 include the migration of the SI upper boundary to HB 11- 5 (1550 m a.s.l.), and the thickening of the upper ice layer in the wet snow zone. • An increase in 3-m bulk density is observed at all sites between MB 5-8 and MB 15-9. Relative to spring 2006, the bulk density in spring 2012 increased from 17% at MB 8 to 35% at MB 12-6. The increases are larger at sites HB 9-1 and below, the region where most of the stratigraphicchanges took place. • By spring 2009, the 3-m bulk density already reached levels comparable to those found in springs 2011 and 2012. Summers of 2007-2008 were at the beginning of the accelerated warming period [2]. The sharp increase in JJA mean air temperature compared to previous years is responsible for the increase surface melt energy, surface melt and refreezing of meltwater, which led to an increase in ice content in the first 3 m below the ice cap surface. C33B-0653: CHANGES IN THE FIRN STRATIGRAPHY ON THE DEVON ICE CAP, CANADA, DERIVED FROM GROUND-PENETRATING RADAR SURVEYS AND FIRN CORE STRATIGRAPHYGabrielle Gascon*1, Martin Sharp1 and Dave Brugess2*Contact information: gascon@ualberta.ca 1: University of Alberta, Canada2: Geophysical Survey of Canada, Ottawa, Canada Figure 6: Example of the GPR profile of the surveyed transect from 0 km (Site 1) to 39.2 km (Site 3) for spring 2010. Dewow filter, background subtraction, GPS topography correction and a SEC2 gain were applied to the data. White layers represent ice, and purple, firn. The differentfirnfacies are identified. The area within the 2 vertical dotted-lines is zoomed-in below. V.E. = 200X GPR Firn cores were drilled using a Kovacs ice coring drill at all sites in 2006, 2011 and 2012, and every other site in 2008, 2009 and 2010. No cores were drilled in 2007. Cores drilled in 2010 were less than 2 m long and were discarded. Depth of the cores analyzed ranged from 3 to 15 m. Cores were logged on site between 2006 and 2011. In 2012, cores were logged using pictures taken with two different infrared filters. Density measurements were taken using the firn cores’ natural breaks, providing data every 0.04-0.25 m; measurement error is 0.022 kg m3. GPR data were collected along the main transect each spring between 2007 and 2012 using a Noggin 500 MHz instrument from Sensors and Software. Data collected in 2008 were discarded due to the malfunction of the instrument. In 2012, GPR surveys were also made in grid patterns measuring 100 m across the transect by 200 m along the transect at 4 different locations along the main transect to examine the spatial horizontal variability in the internal reflecting horizons (IRH) detected by the GPR. GPR positioning was determined through concurrent real time differential kinematic measurements with an accuracy of < 0.5 cm. after post-processing. Coring IR photogrammetry Figure 1: Devon Ice Cap fieldwork sites. The thick line represents the main GPR transect. The bottom right pictures shows an example of the distance separating GPR tracks; distance ranged between 5 m and 65 m. GPR grid surveys were made at the three HB sites and Site 2 in 2012. Firn cores have been drilled at all the labeled sites along the transect. 2-m air temperature was measured for the 2006-2011 period with a Beta Therm 100K6A probe mounted on an automated weather station (AWS) at Site 2. Contour intervals are 50 m. Density at natural core breaks 3. GPR VELOCITY CALIBRATION AND DEPTH VALIDATION The GPR velocity was calibrated using 2012 firn core stratigraphy at the 3 HB sites and Site 2 using a built-in routine for hyperbola velocity calibration in the EKKO_View Deluxe software from Sensors and Software. Analysis was extended to 8-m deep since only firn is present below this depth. The depth of the shallowest transition layer between ice and firn of thickness greater than 0.10 m was used for the first GPR velocity calibration at each site. In Figure 2, this depth is 4.5 m at Site 2. Calibration at the 4 sites led to a mid-range velocity of 0.23 m/ns for firn and ice. Using this velocity, depth error of the ice layers ranged from 0.10 m to 0.25 m, and depth error of the firn layers ranged from 0.10 m to 0.35 m. Figure 7: (Top) Elevation profile between MB 5-8 and MB 15-9 from corrected differential GPS survey. (Bottom) Spring 2007-2012 GPR profiles between MB5-8 and MB15-9. Wave-like patterns are associated with rolling topography. Data processed as in Fig. 6. VE = 200X. (Right) JJA mean 2-m air temperature between 2006 and 2011 at Site 2 from AWS measurements. Figure 2: Example of GPR velocity calibration for Site 2 using ice core stratigraphy. White represents ice layers, and red and blue, firn of different densities. SEC2 gain and a Hilbert transform envelope were applied to the GPR data. 0-5 ns is a mixture of fresh snow and noise. 4. GPR CHARACTERISTICS OF SNOW FACIES At HB 4-7, vertical structure is observed in the GPR profile. This is characteristic of the percolation area. Although no IRH can be identified, there is homogeneity in the profile. HB 9-1 is in the wet snow zone. An ice layer is present at 2-3 mdepth. HB 13-7 is situated in the superimposed ice (SI) region. A 4-m thick ice layer is well identified above a 2-m firn layer (5-7 m deep) and a 0.75-m ice layer (7.25-8 m deep). Some horizontal spatial variability is observed in the thickest ice associated with the recent transition from the wet snow to the SI zone. GPR characteristics at Site 2 are similar to HB 13-7. Greater horizontal spatial variability is observed associated with the non-continuous firnlayers between 2 and 4 m deep. Figure 8: Spring 2006-2012 3-m bulk density from firn core analysis at each site. 7. CONCLUDING REMARKS References: [1]Gardner, A. S., G. Moholdt, B. Wouters, G. J. Wolken, D. O. Burgess, M. J. Sharp, J. G. Cogley, C. Braun, and C. Labine. 2011. Sharply increased mass loss from glaciers and ice caps in the Canadian Arctic Archipelago. Nature, 473(7347), 357-360. [2]Gascon, G., M. Sharp, A. Bush. Changes in the melt season characteristics on Devon Ice Cap, Canada, in the 21st century, and their association with the Arctic atmospheric circulation. Annals of Glaciology, 54(63) (in press). [3]Sharp, M., D.O. Burgess, J.G. Cogley, M. Ecclestone, C. Labine, and G.J. Wolken. 2011. Extreme melt on Canada's Arctic ice caps in the 21st century. Geophys. Res. Lett., 38, L11501, doi:10.1029/2011GL047381. [4]Wolken, G., Sharp, M. and Wang, L. 2009. Snow and ice facies variability and ice layer formation on Canadian Arctic ice caps, 1999-2005. Journal of Geophysical Research 114, F03011, doi:10.1029/2008JF001173. • Spatial variability of firn and ice layers: • Grids in the SI area showed more horizontal variability due to the uneven distribution of firn layers within the thicker ice. • Overall, little small-scale horizontal variability is present in the accumulation area of the Devon Ice Cap. • Changes in GPR profile from multi-year comparisons are not associated with spatial horizontal variability of firn and ice layers. • Changes in the subsurface firn and ice layers between spring 2007 and spring 2012: • The SI area migrated from 1430 m a.s.l. in spring 2007 to 1550 m a.s.l. in spring 2012. • The wet snow zone migrated from 1520 m a.s.l. in 2007 to 1640 m a.s.l. in spring 2012. • A 17-35% increase in 3-m bulk density was observed at all sites between MB 5-8 and MB 15-9. • Observed changes are linked to an increase in percolation and refreezing of melt water at higher elevations. Figure 3: Example of a 100-m GPR line across the main transect line at each of the 4 grid sites showing the GPR characteristics of 3 differentfirnfacies in the accumulation area of the Devon Ice Cap in spring 2012. Dewow filter, background subtraction, topography correction and a SEC2 gain were applied to the data. V.E = 4.1X