Download
1 / 20
200 likes | 329 Vues
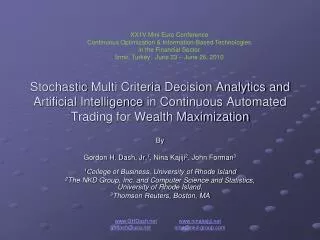
XX1V Mini Euro Conference Continuous Optimization & Information-Based Technologies in the Financial Sector Izmir, Turkey: June 23 – June 26, 2010. Stochastic Multi Criteria Decision Analytics and Artificial Intelligence in Continuous Automated Trading for Wealth Maximization. By

E N D
XX1V Mini Euro ConferenceContinuous Optimization & Information-Based Technologies in the Financial SectorIzmir, Turkey: June 23 – June 26, 2010 Stochastic Multi Criteria Decision Analytics and Artificial Intelligence in Continuous Automated Trading for Wealth Maximization By Gordon H. Dash, Jr.1, Nina Kajiji2, John Forman3 1College of Business, University of Rhode Island 2The NKD Group, Inc. and Computer Science and Statistics, University of Rhode Island. 3Thomson Reuters, Boston, MA www.GHDash.netwww.ninakajiji.net ghdash@usa.netnina@nkd-group.com
Outline • Justification • Objective • Continuous-Time Stochastic Processes • Ito’s Stochastic Integral • Buy-Hold Trading Strategy • N-Dimensional Trading Strategy • K4-RBF • Empirical Example – WINKS • Firm Fundamentals • Conclusions
Justification Complexities of trading across global markets High frequency, or mathematical modeling, of stock price behavior to trade efficiently continues to gain in popularity Stochastic methods are relevant as they rely upon random and pseudo-random methods to define an asset’s price
Objective To assign stocks to wealth-building groups based on the historical trading performance of WINKS. To define the operational characteristics of the HF Trading system -- WINKS. To estimate the relative elasticity of firm-fundamental metrics to explain the production of WINKS trading profitability.
Model for Equity Trading Profits • Let Xt be a stock’s market price at time t • We assume that the price process X follows a geometric Brownian motion with a constant drift and volatility. • Let θ represent a trading strategy. • Let θt (ω) be the quantity of each security held in each state ω є Ω and at each time t. • We assume that the trading strategy can only make use of available information at any time t. Thus preventing the possibility of unlimited gains trough high-frequency trading or flash-crash trading – i.e. θ is adapted. • We thus can define the total financial gain as: • between any time s and r – (Ito’s stochastic integral).
Buy and Hold Strategy (BH) Position is initiated after some stopping time T and closed at a later stopping time U. For a position size θt (ω), the trading strategy θ, is defined by θt = 1(T<t<U)θt (ω). The gain from BH is:
The N-Dimensional Trading Strategy • Suppose we have n different securities with price process: X1, … Xn and a trading strategy of θ = (θ1, … θn) then the total gain is:
K4-RBF Various ANN algorithmic topologies have been used in market prediction and forecast behavior. The use of ANN to exploit complex financial optimization and mapping studies continues due to: The RBF ANN can approximate any continuous function uniformly on compact sets by increasing the nodes in the hidden layer. It is known for speed of modeling large datasets We employ the K4-RBF ANN. The K4-RBF optimizes convergence by extending the traditional RBF to include a Bayesian closed form solution to the computation of the weight decay parameter(s).
K4-RBF Extensions • The Kajiji (2001) extension to the traditional RBF ANN specification introduced multiple objectives within a Bayesian RBF ANN framework. By adding a weight penalty term to the SSE optimization objective, the modified SSE is restated as the following cost function: • Under this specification the function to be minimized is stated as:
Trading Benefit the K4 ANN Excellent mapping capabilities of the RBF topology allows for better forecasts for a system exhibiting Brownian motion – such as stock price movements. The algorithmic speed of the generalized RBF is greatly enhanced by the K4 enhancements making it suitable for HF valuation in N dimensional space.
A Sample of Trading ProfitabilityThe BH Strategy v/s HF Automated Trading: June 01, 2009 to March 19, 2010 The database of 2,225 securities was established by random selection from the 8,000 tickers followed by Yahoo! Finance. These five were chosen for demonstration as they have the highest trading profit. Trading Efficiency = ((Profit or Loss) / Ini. Investment) *100. Note: All stocks have an ini. investment of $1000 Current status can be viewed at: http://www.nkd-group.com/index/index.htm
Do Firm Fundamental Factors Affect % Positive Trades? • Goal: To use the K4 mapping efficiency to estimate non-parametric quasi-elasticity metrics of individual firm fundamental variables in the production of K4 trading profitability. • Which firm fundamental variables to use? • Fama & French (1993) found a three factor model efficiently modeled the excess returns of individual firms. • Subsequently, Carhart(1997) extended the FF model by including a fourth factor. • We approximate the Carhart four factor model: • Vasicek’s Beta (Bayesian corrected Beta) Standard CAPM • Market Capitalization FFM added factor • Book to Last Trade Price FFM added factor • Percent change from 50 day Moving Average Carhart extension
K4- Estimation of Production Scale Economies • Establish historical period: 01-Jun-2009 through 19-Mar-2010, inclusive. • Create research sample (SAM): • Obtain 20-minute price observations for 2,225 securities. • Eliminate all non-equity stocks, and stocks that do not have fundamental information on Yahoo! -- sample size reduced to 1,765. • For efficient cross-sectional modeling we sample from within the full content population. The data sampling is guided by the use of the target variable of the study – percent positive trades (PPT). • We have 793 securities for the training set; and 972 securities for the validation set. • For SAM, obtain stock fundamentals (source: Yahoo Finance) • Vasicek’s Beta - created from reported Yahoo beta. (P1) • Market Capitalization (P2) • Book to Last Trade Price (P3) • Percent change from 50 day Moving Average (P4)
ResultsNumber of Positive Trades by Security for SAM of 1,765 Securities Notice that the %positive trades form a band between 30% and 70%
The Production Model • Use K4 to estimate the double-log production theoretic model for positive trades. • pi = f(P1, P2, P3, P4) • Where: • pi = Ln(PPT) • P1, P2, P3, P4 = Ln transformation of indicator variables as previously defined • K4-RBF implemented with a softmax transfer function • K4 RBF weights are interpreted as quasi-production elasticity estimates • Sum to capture system returns to scale for profitable trading
A Sample of Alternative Modeling ResultsK4-RBF Analysis Using Softmax Transfer FunctionDependent Variable: Ln(% Positive Trades)Indicator Variables: Ln(Fundamental Variables)
ResultsComparative K4 RBF Weights from the Alternative ModelsDependent Variable: Ln(% Positive Trades) • Model selected – Norm2 • Except for the variable Market Capitalization, all other variables show an inverse relationship to PPT. That is, Market Capitalization is the only variable that can improve PPT given any positive change in market size. • Interestingly any increase in Book Value to Price tends to lessen the probability that WINKS will trade the stock profitably. • The K4 production model exhibits decreasing returns to scale of 0.484 units. This implies a decrease in PPT given a simultaneous and proportionate change in all indicator variables (factors of production).
Conclusions • This research provides a synthesis of stochastic equity price behavior and the cognitive science of trading by implementation of the dual objective K4-RBF ANN as incorporated in WINKS. • WINKS is an MCDA trading algorithm that integrates the AI properties of two unique, but coordinated, high-frequency RBF ANNs. • Test results produced transaction cost adjusted trading profits that exceeded those generated by the simple buy-hold strategy. • WINKS performance was modeled using a four-factor firm pricing model to estimate the system-wide returns to scale of PPT. • The results suggest that the portfolio selection of stocks based on the estimated quasi-elasticity coefficients would greatly enhance trading profits. A test of this conclusion is left for future research.