Download
1 / 68
690 likes | 710 Vues
Explore the history, rationales, and methods of income redistribution to achieve equity. Analyze income distribution data, poverty lines, and the impact of in-kind transfers. Learn about income inequality trends and factors affecting poverty rates in different provinces.

E N D
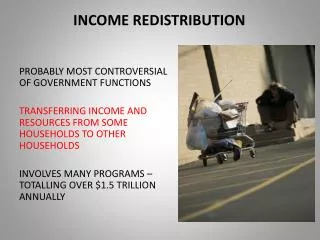
Chapter 6: Income Redistribution If the government actively pursues a policy of equitable distribution, what is considered equitable? As always, EQUITY and EFFICIENCY are the two conflicting issues the government deals with.
Chapter 6: Income Redistribution • History of Income Distribution • Rationales for Income Redistribution • Cash vs. In-Kind Transfers • Overview
History - Income Distribution In 2008: The poorest 20% of the population received 4% of before-tax income The poorest 60% received 29% of before-tax income This is represented in the LORENZ CURVE, where a 45% line represents equal income distribution Note that income inequality has increases slightly since 1980.
Lorenz Evaluation -Between 1980 and 2008, income share of the top 20% increased, and income share of all other quintiles decreased -often blamed on globalization and welfare cutbacks -But similar changes occurred between 1961 and 1991, when welfare programs expanded and there was economic growth -this increase in income inequality may just be temporary
Theory - The Poverty Line POVERTY LINE -real income needed to provide a minimally adequate standard of living -Statistics Canada instead uses Low Income Cut-Off-Lines (LICO) where a family would use 54.7% of its income on food, clothing, and shelter as defined by 1992 expenditure patterns
History - The Poverty Line The 2008 Low Income Cut-Off line for an unattached individual was: $22,171 for an in a 500,000 or greater urban area $15,562 in a rural area The 2008 LICO line for a family of 4 was: $41,198 for an in a 500,000 or greater urban area $28,361 in a rural area
The Poverty Line -The next graph shows Canadians below the cut-off line over time from 1980 to 2004 -note that poverty figures followed income figures and the recession -note that the statistics for children living in low income is above average -note that although overall the elderly living in poverty has decreased, 33.7% of elderly peoples living alone in 2008 lived in poverty
History - Poverty By Province 2008 poverty varies across Canada, from 9.1% of families in Alberta to 16% of families in Quebec
Poverty By Province -35.1% half single-mother families are below the poverty line (improved from 2005), and single father families fare worse than two-parent families -a second paycheque is often required for a “reasonable” standard of living -stay-at-home parents have a disadvantage -unfortunately, studies show that stay-at-home parents have a huge positive effect on their children, especially in early years
Theory - Calculation Difficulties All these numbers don’t take into account IN-KIND income -When a household member does work (childcare, housecleaning, roof shoveling, tax filing, plumbing, etc), it is not counted as income -If these activities were paid for, they would appear as income -Single parent households therefore have a lower income (in-kind or reported) -Stay at home parents have a higher true income than reported
Further Issues -all the above data is before-tax, and therefore doesn`t consider higher taxes for higher incomes -keep in mind that a person $1 below the poverty line is treated the same as someone $10,000 below the poverty line in this chart GAP RATIO =(Income-LICO)/LICO -the aggregate low income gap ratio has decreased to 33% in 2008 from 35% in 1980
Theory – Family Categories -Statistics Canada lists a household as “a group of individuals sharing a common dwelling and related by blood, marriage (including common-law) or adoption -Anyone else is considered (such as someone with unrelated roomates) an “unattached individual” -2008 unattached individual income was $36,800, and family income was $89,700 -The average family had 3 people
Family Categories -Families have savings in consumption (especially the consumption of housing) -Statistics Canada considers a second adult of a family unit to increase household needs by 40%, and each child to increase household needs by 30% -Therefore the average family has needs of 1.7 unattached individuals. A family receiving $89,700 thus has the equivalent unattached individual income of $52,764 -This is arbitrary, but argues the average 3-person family is better off
Theory – Data and Distribution -Typical income data is yearly, which is not perfect, as income tends between years (person A may have a higher income due to being older than person B) -Income distribution in Canada has varied little since 1951 -This is odd, since social programs increased greatly after WWII -perhaps preventing a huge income shift? -could have further programs done more?
Theory - Poverty Conclusion -EXACT income inequality sources are highly studied and still debated -Studies show family income inequality comes from differences in wages and salaries for family heads BUT -Property income (interest and dividends) accounts for little of the inequality
Theory - Poverty Conclusion WHY different wages? Wage = f(strength, intelligence, effort, education, marriage decisions, discrimination, welfare, luck) -computer technology is making education a huge factor of wage, -BUT DOESN’T EXPLAIN EVERYTHING
Theory - Rationales for Income Redistribution There are a variety of rationales for income redistribution, all requiring unique underlying assumptions: • Utilitarianism • The Maxmin Criterion • Pareto Efficient Income Redistribution (Insurance and Alturism) • Nonindividualistic Views • Other (ie: Fairness/Good Rules, etc)
1) Theory - Utilitarianism -Social welfare is a function of undividual utility: W=F(U1, U2,…,Un) -Certain utilitarianism philosophers (Bentham and Mill) argued that public policies should be guided by the principle, “greatest good for the greatest number"
Utilitarianism -Economists typically interpret this idea through an additive social welfare function: W=U1+U2+…+Un -The utilitarian therefore supports income distribution as long as it increases social welfare
Utilitarianism Assumptions -In order to take this analysis further, one needs to add 3 assumptions: • Individuals have identical utility functions only depending on income U=f(I) • Diminishing marginal utility of income exists • Total societal income is fixed -Therefore welfare is maximized when incomes are completely equal:
Utilitarian Example Consider a society with two people, Richard (who starts rich) and Po (who starts poor). Graphically, our x axis can represent the entire income available in society (assumption 3) Richard and Po’s marginal utilities are measured along opposite sides, as they are both functions of income, and both diminishing due to assumption 2 -They are symmetrical due to assumption 1
Utilitarian Welfare: MUR MUP Richard’s income is Ox, and Po’s income is O’x. O x O’ The distribution expressed by point x (Richard is richer than Po) implies a high MU for Po and a low MU for Richard.
Utilitarian Example Redistribution of income makes one person worse off and another better off -The change in utility is expressed by the area under the utility curve -we see that if Richard gives money to Po, Po’s gained utility is greater than Richard’s lost utility, resulting in higher social welfare -social welfare is thus maximized at I, where both people have half the available income
Utilitarian Welfare: MUR MUP If income moved from x to w, Richard would lose utility tvxw while Po would gain utility rsxw. s r t v I w x O O’ Society’s gain would therefore be rsvt. Social welfare would be maximized at point I.
Utilitarian Criticism -This result seems too easy – society is best off if everyone has EXACTLY the same income In order to evaluate this result, we have to look back to Utilitarianism’s underlying assumptions
Utilitarian Assumption 1 We can’t ACTUALLY measure utility, nor can we determine if people have identical utility functions. However: • It seems reasonable -If people are similar in other characteristics (height, weight, etc.), why not utility? 2) It should be so (ethics) -Perhaps government should act according to identical utility functions, to avoid bias ASSUMPTION 1 IS WEAK, BUT MAY SURVIVE
Utilitarian Assumption 2 We can prove diminishing marginal utility of a GOOD, but not of INCOME -Perhaps someone can keep spending income on different things to keep his marginal utility high If Marginal Utility is constant, then a dollar taken away from Richard causes a decrease in utility equal to the utility gained by Po ASSUMPTION 2 FAILS?
Utilitarian Assumption 3 People typically gain utility from leisure, and therefore transfers discourage work and cause a reduction in overall income -Therefore each dollar transfer causes a reduction in available income -If we aim for a 50%/50% balance, this balance suddenly becomes unequal as perhaps only 90% of the income is now available (so the balance becomes 50%/40%) ASSUMPTION 3 IS PROBLEMATIC
Utilitarian Social Welfare 45* Line In Utilitarianism, Social Indifference Curves are straight lines i With no tax distortion, point ii is optimal iii ii Maka’s Utility With tax distortions, point iii is optimal W`` W` O Susan’s Utility Maka
2) Theory - The Maxmin Criterion -if the social objective is the maximin criterion, society attempts to maximize the utility of the least well-off person: W=min(U1, U2,…,Un) -This claims that society is only as well off as its “worst” member -There is an implicit argument for equality, but income variance is still allowed for -ie: don’t overtax the rich to pay the poor if it makes the poor lose their jobs
Maxmin Social Welfare 45* Line Social Indifference Curves are right angles i With no tax distortion, point ii is optimal W`` Maka’s Utility ii W` iv With tax distortions, point iv is optimal O Susan’s Utility Maka
Maxmin vs. Utilitarian Social Welfare 45* Line With no distortion, the results are identical i With tax distortion, maxmin theory argues for more redistribution thus higher inefficiency iii Maka’s Utility ii iv W`` W` O Susan’s Utility Maka
The Maxmin Criterion Criticism -this is based on John Rawls’(1971) idea of an ORIGINAL POSITION -theoretically, if people didn’t know their place in society, they would want the lowest place to be as well-off as possible -this assumes everyone is VERY risk adverse -Feldstein (1976) also points out that this condition allows for policies creating a few extreme rich and penalizing most of society as long as the poorest gains slightly
3) Theory – Pareto Efficient Income Redistribution Utilitarian and maxmin models do NOT provide Pareto Efficient Income redistribution -one person is made WORSE OFF (lose income) Income Redistribution can be a Pareto Improvement under concepts of: • Altruism • Insurance
3a) Theory - Altruism -Due to altruism, Richard may GAIN utility from giving money to Po (a Pareto improvement) -ideal redistribution would continue until Richard’s Marginal Utility gain from altruism equals his Marginal Utility loss from lower income -one may argue that the government can find the poor easier than Richard can
Altruism -taken to the extreme, income distribution becomes a PUBLIC GOOD, because everyone gains utility from knowing the poor are taken care of -the free-rider problem argues for the government forcing redistribution payments (people will naturally wait someone else to take care of the poor) -Many argue that people don’t need the government to redistribute their money, they could do it if they wanted
3b) Insurance -many have self-interest reasons for favoring insurance -Income redistribution payments are premiums against the risk of becoming poor -Additionally, income redistribution is insurance against civil unrest -give the poor food so they don’t become Robin Hood
4) Theory - Nonindividualistic Views -Thus far we have argued that redistribution policy should come from the social welfare function -Some argue that social redistribution should be independent from individual tastes -Fair (1971) pointed out that Plato argued that in a good society: -Others simply argue that equal distribution is paramount
5) Theory – Other/Fairness -the previous models assumed that society should distribute ITS income as it sees fit -(assumes people don’t own income) -one could examine the FAIRNESS of initial income earning or income redistribution -should EQUAL OPPORTUNITY be the goal, regardless of the income distribution that results? -in this case there would be no room for government redistribution
Other/Good Rules -Nozick (1974) argues that income belongs to individuals, and government should ensure “good” sets of rules to govern society’s operation, not “good” income distribution -But how can one evaluate “good” rules without examining income distribution?
Other/Fairness (another look) -others argue that social mobility is paramount -it doesn’t matter if people are poor now, as long as there is a decent chance of their situation changing -Chen (2009) showed that: 1) 70% of Canadians moved to another decile group in 5 years and 2) 30-40% moved UP at least one decile Note: decile groups (11-20%,41-50%, 91-100% etc)
Cash vs. In-Kind Transfers Thus far we have assumed income is redistributed in the form of cash transfers -Often the poor receive in-kind transfers (food, education, healthcare, etc) -There are a variety of pro’s and con’s when comparing cash to in-kind transfers:
Composite good, units Example: Consider a situation where an individual consumes Fa food, yet the government considers the minimum food an individual needs as Fmin. Maximum food consumption is I/Pf I A Food (units) FA FMin I/Pf
Composite good, units One option is to offer a food voucher FV, increasing utility and consumption to point B. Note that non-food consumption also increases slightly I • A B • Food FA FV FMin I/Ph I/(1-s)Ph
Composite good, units Without the subsidy, C2 is the level of consumption that could be undertook at the minimum food consumption. Therefore V is the cost of the food subsidy I • A B • V C2 Food FA FV FMin I/Ph I/(1-s)Ph
Composite good, units An alternative to the subsidy would therefore be a lump-sum transfer. In THIS case, the outcome is the same I • A B • V C2 Food FA FV FMin I/Ph I/(1-s)Ph
Composite good, units Depending on the utility function, the individual COULD use some or all of the cash transfer on composite goods rather than food, achieving higher utility • B • I A • V C2 Food FA FV FMin I/Ph I/(1-s)Ph