Download
1 / 11
110 likes | 293 Vues
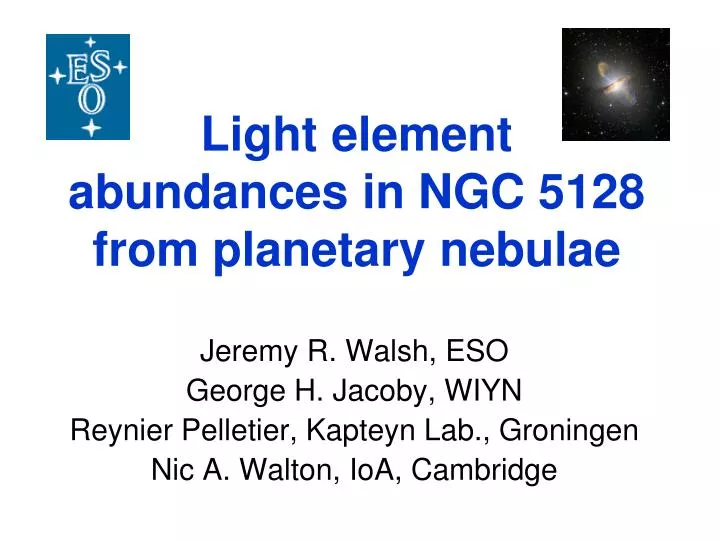
Light element abundances in NGC 5128 from planetary nebulae. Jeremy R. Walsh, ESO George H. Jacoby, WIYN Reynier Pelletier, Kapteyn Lab., Groningen Nic A. Walton, IoA, Cambridge. Planetary nebulae.

E N D
Light element abundances in NGC 5128 from planetary nebulae Jeremy R. Walsh, ESO George H. Jacoby, WIYN Reynier Pelletier, Kapteyn Lab., Groningen Nic A. Walton, IoA, Cambridge
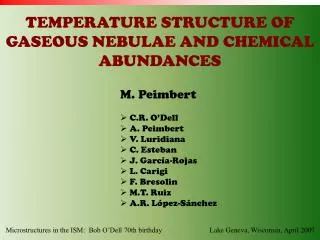
Planetary nebulae • Low mass (~0.7-7Mסּ ) main sequence stars undergo a planetary nebula (PN) phase at ages 0.1-10Gyr depending on initial mass, following the red-giant branch (RGB) and asymptotic giant branch (AGB) to the white dwarf cooling track • Length of PN phase ~104 yr (depending on core mass) • Emission from the expanding shell ionized by the hot (50-150,000 K) central star • Ionization level falls with distance from star (and density) giving a wide range – neutral species (O0) to > 100ev (Ne 4+) Nebulium [O III]
Planetary nebula spectra • O is the most efficient coolant for the nebula • < 15% of the stellar luminosity (1-2x10⁴ Lסּ) is emitted in a single collisionally excited line O++1D2 – 3P2 [O III]5007Å • This strong line allows detection of PN; high [O III]/Hα ratio discriminates against HII regions • Other lines of H, He, N, Ne, Ar, S prominent in optical spectra of PN • Line ratios dependent on Te, Ne and abundance • Some line ratios of same species dependent on Te and/or Ne. Example: [O III]5007/4363 => Te • Determine O abundance: [O II]3727Å / Hβ => O+/H+ [O III]5007Å / Hβ => O++/H+ O IV 1401 / H => O3+/H+ O/H = O+/H+ + O++/H+ + O3+/H+ + … • Problems: RGB and AGB modifies original stellar abundances (C & N, also He, and possibly O) Collisional lines of O and Ne show different abundances to recombination lines (weak)
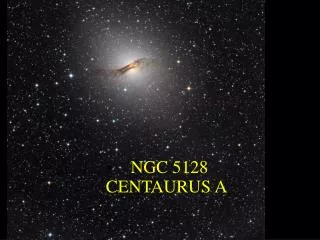
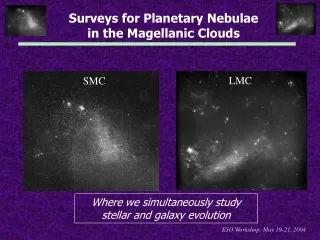
Planetary nebulae in NGC 5128 [O III] • 785 PN catalogued in early 1990’s (Hui et al, 1993); further 350 by Peng et al. 2004; another ~500 from NTT imaging survey => 1600 PN . All from on-band/off-band imaging • The strong emission lines allow three probes: Detection and photometry of PN from [O III] emission line objects. Luminosity function (PNLF) fitting => distance. E.g. Hui et al. (1993) measured 3.5Mpc Measurement of radial velocity from emission line(s) => rotation curve, mass estimate, dark matter Measurement of many lines => abundances of light elements • Three pronged programme: • Extensive imaging with NTT EMMI (imager / spectrometer) to obtain a statistically complete sample over whole extent of galaxy (to <80kpc) • VLT FLAMES multi-fibre spectra of the strongest lines [O III]4959,5007Å for radial velocities (~1070 PN measured) → Poster • FORS multi-slit for detailed optical spectra (3500-7000Å) for abundance measurements (50 PN) Cont.
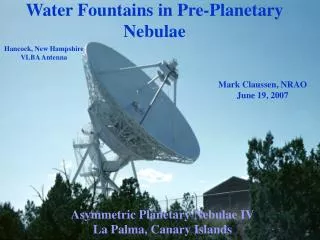
FORS1 MOS observations FORS1 MOS and WF/PC2, ACS fields • Three fields at a range of radial offsets of 4’ (F42), 7.5’ (F56) and 14.5’ (F34) • Observing catalogued PN from Hui et al. (1993) maximizing number observed per field with18 slitlets of FORS1 • Blue spectra – (600B) 3500-5500Å, R~2.3Å for [O II] 3727 to [O III]5007Å • Red spectra - (300V) 4500-8500Å R~5Å for Hα/Hβ, He I, [N II], etc. • Exposures to 3hrs per field per spectral range ESO 2.2m WFI Hα HH8 HH21 HH31
Extracting PN spectra • PN at distance of NGC 5128 are point sources so extract PN spectra from background galaxy distribution • Galaxy continuum strong in inner fields (e.g. Hβ absorption strong) • No. of PN extracted: • Field F56: 20 PN • F42: 21 PN • F34: 9 PN 50 PN detected in total • 23.5 < m5007 < 28.1 Faint PN not in image catalogues m5007 = 27.5 Sky+background subtracted λcalib field F56 FORS1 MOS spectrum
Radial trends from PN line emission • Extinction correction (from Hα/Hβ and Case B). Limit is Schlegel et al. (1998) EB-V=0.11 • [O III]/Hβ shows no trend, except some higher values near centre (Field 42). Assuming most PN have similar stellar temperature and most of O in O++ => O/H abundance • [Ne III]/[O III] very constant as found in other PN studies (MW, MC’s). Ne/O ratio ‘fixed’ by early high mass star evolution and marginal evidence for O enrichment by PN central stars
Stellar continuum • NGC 5128 PN show a range of metallicity but no obvious radial gradient (c.f. stellar gradient) • Previous puzzling result that PN show sub-solar O/H confirmed, but some higher values (to Solar) • Velocity data (rotation curve) required to determine ‘true’ radial distance for abundance gradient Extra-PN galaxy continuum
Abundance measurements • Te sensitive [O III]4363Å line detected in 4 PN; 3 in outer field (low background) • Summed all spectra in each field for higher S/N line detections. Apply mean Te, Ne diagnostics to all PN in each field • Determined He/H, O/H, N/H and Ne/H for each PN where lines detected • PN without detected [O II] => lower limit to O/H. He++/H to correct for unseen ionization stages (e.g. O3+)
ODF • Extinction correction (from Hα/Hβ and Case B). Limit is Schlegel et al. (1998) EB-V=0.11 • [O III]/Hβ shows no trend, except some higher values near centre (Field 42). Assuming most PN have similar stellar temperature and most of O in O++ => O/H abundance • [Ne III]/[O III] very constant as found in other PN studies (MW, MC’s). Ne/O ratio ‘fixed’ by early high mass star evolution and marginal evidence for O enrichment by PN central stars
PN and star formation history • Extinction correction (from Hα/Hβ and Case B). Limit is Schlegel et al. (1998) EB-V=0.11 • [O III]/Hβ shows no trend, except some higher values near centre (Field 42). Assuming most PN have similar stellar temperature and most of O in O++ => O/H abundance • [Ne III]/[O III] very constant as found in other PN studies (MW, MC’s). Ne/O ratio ‘fixed’ by early high mass star evolution and marginal evidence for O enrichment by PN central stars From Marigo et al. 2004