Download
1 / 45
450 likes | 625 Vues
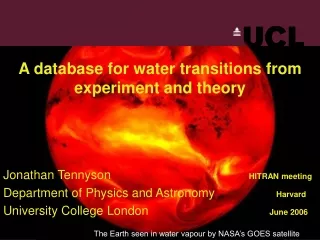
A database for water transitions from experiment and theory. Jonathan Tennyson HITRAN meeting Department of Physics and Astronomy Harvard University College London June 2006.

E N D
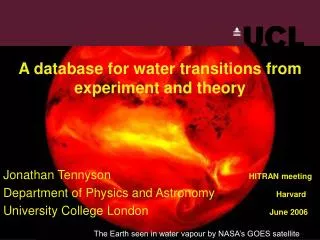
A database for water transitions from experiment and theory Jonathan Tennyson HITRAN meeting Department of Physics and Astronomy Harvard University College London June 2006 The Earth seen in water vapour by NASA’s GOES satellite
Why water vapour? • Molecule number 1 in HITRAN • Major (70%) atmospheric absorber of incoming sunlight • Even H218O is fifth biggest absorber • Largest (60%) greenhouse gas • Atmospheres of cool stars • Combustion • Life !?
UCL strategy for a reliable, complete (300K) linelist • Strong lines: water-air spectra, variable path-length • Weak lines: water vapour spectra, longest path-length & integration times possible • Isotopologues: Isotopically enhanced samples (Kitt Peak, CRDS) • Completeness/assignments: High quality variational calculations
IUPAC Task groupA database of water transitions from experiment and theory • Water lines at room temperature (HITRAN) • Hot water • Isotopologues • Line profiles • Theory • Validation • Database Meet room P226 “Tea Room” Weds from 2.30 pm Thurs until lunch
Scope • transitions 0 - 30,000 cm-1. • linelist for room temperature (C, 296 K) & hot (H) water. • Ccomplete for intensities > 10–29 cm molecule–1 • in natural abundance. • Singly & doubly substituted isotopologues: • HD16O, H218O, H217O, D216O, HD17O, and HD18O. • No triply substituted isotopologues, no tritium. • Line profiles: function form? • Broadening parameters γ and δ. • Dependence: pressure (0 – 3 atm), temperature (200 – 300 K) • Experimental & computational data. • Parameters for self- , N2, O2, air, and H2 broadening.
Database • Master database to be prepared for each isotopologue. • Should capture origin & time-dependence of measured and computed values. • Both ‘old’ and ‘new’ data archived and accessible. • Flexible in terms of data structures • HITRAN “button”
Master file strategy • Use most complete (not necessarily best) as Master file eg BT2 • Augment with data from other sources: expt, other theory • Store all known data: use error analysis to combine • Clear data history • Files structured by function: levels, transitions (+ mixings?) • Distributed data? • Some functionality in-built eg HITRAN button
New BT2 linelist Barber et al, Mon. Not. R. astr. Soc. 368, 1087 (2006). http://www.tampa.phys.ucl.ac.uk/ftp/astrodata/water/BT2/ • 50,000 processor hours. • Wavefunctions > 0.8 terabites • 221,100 energy levels (all to J=50, E = 30,000 cm-1) 14,889 experimentally known • 506 million transitions (PS list has 308m) >100,000 experimentally known with intensities • Partition function 99.9915% of Vidler & Tennyson’s value at 3,000K
Energy file: N J sym n E/cm-1 v1 v2 v3 J Ka Kc
Transitions file:Nf Ni Aif 12.8 Gb Divided into 16 files by frequency For downloading
Master file strategy:Inclusion of Experimental (+ other theoretical) data Added to record. Data classified: Property of level Energy File • Experimental levels (already included) • Alternative quantum numbers (local modes) Property of transition Transition File • Measured intensities or A coefficients • Line profile parameters Line mixing as a third file? Location of partition sums?
Main characteristics (poster by Attila Csaszar) • Dual database of rovibrational energy levels and rovibrational transition with well-defined uncertainties • Complete collection and storage of all relevant spectroscopic data for all major isotopologues of water • Critical evaluation of data which will always carry their own pedigree (e.g., bibliographical references, important measurement conditions, metadata) • Inclusion of intensities, line widths, and line broadenings in the database, possibly including refinement of relevant parameters • Global multi-dataset optimization • Curation, organizational, data-mining and displaying tools • Allow immediate (and automatic) consistency analysis of newly reported data before data deposition • Allow „experiments” with what-if scenarios (important in order to predict what extra information new experiments might provide • All supporting programs written in C++ and Java • Sensitivity analysis of uncertainties • Reproduce all known and well-defined experimental data (time-dependence) • Predictions are rigorously quantified by their respective uncertainty bounds • Minimal chance of leaving feasible regions of parameters • HITRAN „button” to produce the best available data in HITRAN form for modeling studies
IUPAC Task groupA database of water transitions from experiment and theoryMEMBERS: Peter Bernath (Waterloo, Canada); Alain Campargue (Grenoble, France); Michel Carleer (Brussels, Belgium); Attila Császár (Budapest, Hungary); Robert Gamache (Lowell, U.S.A.); Joseph Hodges (NIST, U.S.A.); Alain Jenouvrier (Reims, France); Olga Naumenko (Tomsk, Russia); Oleg Polyansky (Ulm, Germany); Laurence Rothman (Harvard, U.S.A.); Jonathan Tennyson (London, U.K.); Robert Toth (JPL, U.S.A.); Ann Vandaele (Brussels, Belgium); Nikolai Zobov (Nizhny Novgorod, Russia)
Spectroscopy of water Roman Tolchenov Boris Voronin Lorenzo Lodi Bob Barber Nikolai Zobov Paolo Barletta
Room temperature H216O lines • Strong line data about 9000 cm-1 • Compatability between mid and near infrared intensities • Weak lines throughout whole spectrum • Far infrared? Solution strategy largely experimental plus careful analysis?
Hot water (up to T=3000+ K) • New complete linelist available from UCL Accuracy? • Experimental assignments • New experiments? • H216O only? (Some experiment for HDO and D2O) • Line profiles? Solution strategy: largely theoretical with validation by experiment
Isotopologues • H218O, H217O, HDO lines patchy in visible • D216O not well known above 10000 cm-1 • Any interest in other isotopologues? • Room T only? • Line profiles? Solution strategy Isotopically enhanced experiments
Line profiles • Broadening by which species? water, O2, N2, air, H2,…..? • T dependence? • P dependence? (up to 10 atm?) Solution strategy Theory validated by high quality experiment?
Validation • between experiments • atmospheric spectra • Theory vs experiment • other
Distribution and storage • HITRAN • Web database eg Spectroscopic databank at Tomsk • Publication or other means of distribution?
So what is the problem? Water is well studied (30,000+ lines in HITRAN) But • Water spectra have huge dynamic range • Difficult to work with experimentally • Spectra very dense: baseline hard to characterise • Strong lines usually saturated (water-air spectra) • Line profiles important (water-air & water-water) • Weak lines can be significant (pure water spectra) • Line assignment difficult (Variational Methods)
P. Macko, D. Romanini, S. N. Mikhailenko, O. V. Naumenko, S. Kassi, A. Jenouvrier, Vl. G. Tyuterev and A. Campargue, J. Molec. Spectrosc. (in press).
P. Macko, D. Romanini, S. N. Mikhailenko, O. V. Naumenko, S. Kassi, A. Jenouvrier, Vl. G. Tyuterev and A. Campargue, J. Molec. Spectrosc. (in press).
P. Dupre, T. Germain, A. Campargue, N.F. Zobov, O.L. Polyansky, S.V. Shirin, R.N. Tolchenov and J. Tennyson, J. Molec. Spectrosc. (to be submitted).
Polyad structure in water absorption spectrum Long pathlength Fourier Transform spectrum recorded by R Schmeraul
R. Schermaul, R.C.M. Learner, J.W. Brault, A.A.D. Canas, O.L. Polyansky, D. Belmiloud, N.F. Zobov and J. Tennyson J. Molec. Spectrosc., 211, 169 (2002).
Weak water lines Very difficult to record Only a few weak lines in HITRAN Weak lines: new experimental measurements • MSF data (NERC) : 8m cell, pure water vapour • Schermaul, Learner et al. • Bruker F.T.S. • Range : 9000-12 700 cm-1 • T : 295.7 K • p(H2O) : 22.93 hPa • pathlength ~ 800.8 m • Number of lines : 7923 • Number of new lines : 1082 • Schermaul, Learner et al. • Bruker F.T.S. • Range :11 700-14 750 cm-1 • T : 294.4 K • p(H2O) : 23.02 hPa • pathlength ~ 800.8 m • Number of lines : 5316 • Number of new lines : 1534 Also data in 6000 - 9000 cm-1 region
Weak lines: new experimental measurements • REIMS data, 50 m cell, pure water vapor (also water-air) • Coheur et al., Fally et al. • Bruker F.T.S • Range :13 000 - 25 020 cm-1 • T : 291.3 K • p(H2O) : 18.32 hPa • pathlength ~ 602.32 m • Number of lines: 9353 • Number of new lines : 2286 • Merienne et al. • Bruker F.T.S • Range : 9 250 - 13 000 cm-1 • T : 292 K • p(H2O) : 23.02 hPa • pathlength ~ 602.32 m • Number of lines : 7061 • Number of new lines : small HDO ! Full assignment nearly complete
Water vapour spectrum: new assignments in the blue Long pathlength FTS M. Carleer, A. Jenouvrier, A.-C. Vandaele, P.F. Bernath, M.F. Marienne, R. Colin, N.F. Zobov, O.L. Polyansky, J. Tennyson & V.A. Savin J. Chem. Phys., 111, 2444 (1999)
MSF spectra: line parameter retrieval using GOBLIN Residue of fit residue from fit
Reliable intensities required for satellite retrievals • MSF data (ESA) : 8m cell, water-air spectra • Schermaul, Learner, Brault, Newnham et al. • Bruker F.T.S. • Range : 9000 - 12 700 cm-1 • T : 295.7 K (also 253 K) • p(H2O) : 10.03 hPa • Pathlength: SPAC 4.938 m • LPAC 32.75m, 128.75m, 512.75m • Number of lines : 7923 • Number of new lines : 1082 See poster by Tolchenov
Intensity data compared to HITRAN-96 by polyad for spectral region 8500 – 15800 cm-1 Numbers are ratio of total intensity to Hitran96 HITRAN underestimates intensity of strong lines! D Belmiloud et al, Geophys. Res. Lett., 27, 3703 (2000).
Intensity comparison for strong lines: ESA vs Hitran 2000 Comparison with data from Hitran 96 Comparison with data of Brown et al (2002)
ESA spectra: line parameter retrieval residue of fit Still problems with fit See poster........... 129m water-air spectrum
Validation using atmospheric spectra Atmospheric spectra due to Newnham & Smith (RAL)
Water isotopmers in the visible • Fourier transform spectra in Kitt Peak archive up to 15 000 cm-1 H218O: M. Tanaka, J.W. Brault and J. Tennyson, J. Molec. Spectrosc., 216, 77 (2002). H217O: M. Tanaka, O. Naumenko, J.W. Brault and J. Tennyson to be published • Cavity ringdown spectra from Amsterdam about 17 000 cm-1 H218O: M. Tanaka, M. Sneep, W. Ubachs & J. Tennyson, J. Molec. Spectrosc., 226, 1 (2004). H217O: being analysed at UCL • HDO: Brussels/Rheims spectra of Coheur et al being analysed in Tomsk
Experiment Atmospheric absorption Radiative Transfer Model Theory Missing absorption due to water:First estimates • In the red and visible : • Unobserved weak lines have a significant effect : ~ 3 Wm-2 • Estimated additional 2.5-3 % absorption in the near I.R/Red. • Estimated additional 8-11 % absorption in the ‘Blue’ ? • Underestimate of strong lines even more important : ~ 8 Wm-2 • Estimated additional 8 % absorption in the near I.R/Red.
Missing absorption due to water:Outstanding issues • In the near infrared and red: • Contributions due to H218O, H217O and HDO. • Possible role of water dimer (H2O)2. • In the blue and ultraviolet: • Are H216O line intensities also underestimated? • Contribution due to weak lines