Asian Americans
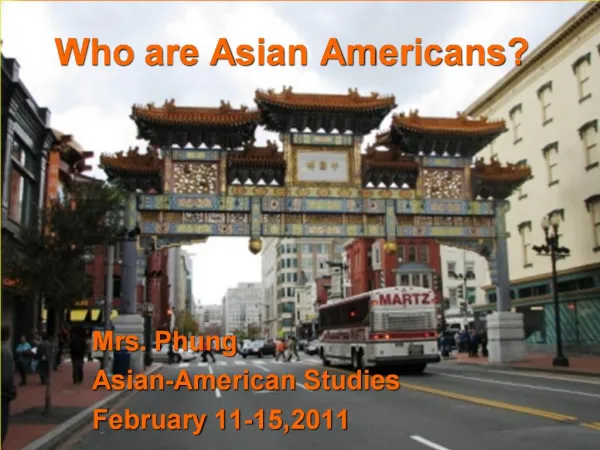
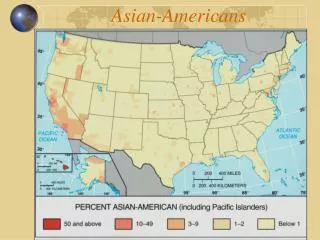
Asian Americans. Where Most Asian Pacific Islanders Live. Asian Pacific Islanders. Chinese Americans and Japanese Americans. Intergroup Relations Continuum. Government Policies toward the Chinese,. The Chinese came to the U.S. during the 1850s California gold rush .

Asian Americans
E N D
Presentation Transcript
Government Policies toward the Chinese, • The Chinese came to the U.S. during the 1850s California gold rush. • They encountered racial hostility despite the overwhelming need for manual labor in the mid-19th century; were often expelled from mining camps, barred from schools and from obtaining citizenship, denied the right to testify in court, and murdered. • After the Civil War, anti-Chinese tensions increased, culminating in the Chinese Exclusion Act of 1882. • The Chinese Exclusion Act (1882) marked the first time the government enacted a human embargo on a particular race of laborers. • Expelled from various trades and occupations as well as from many residential areas, Chinese immigrants had no choice but to congregate in Chinatowns.
Government Policies (continued) • Stages in the development of Chinatowns • Involuntary choice in response to societal prejudice & discrimination • Defensive insulation as a protection to against racist hostility • Voluntary segregation as group consciousness emerges • Gradual assimilation, a process markedly slowed by voluntary segregation and social isolation • Congress ended the ban on immigration from China in 1943.
Government Policies (continued) • Most Chinese who came in the 19th century were farmers, artisans, craftsmen, political exiles, and refugees. Many were sojourners. • Visible because of their race, appearance, and practices, the Chinese aroused both curiosity and suspicion. • A major social problem affecting most Asian immigrants through the 1940s was the shortage in the U.S. was the shortage of Asian women. • After World War II a greater number of Asian women migrated to the U.S. • The Chinese built much of the western part of the transcontinental railroad and cost the railroad company 2/3 as whites to maintain.
Government Policies towards the Japanese • The Japanese arrived in 1868 and settled in the western states where anti-Chinese sentiment was still strong. • Early immigrants entered manufacturing and service occupations. Hostility from union members, resenting Asians’ willingness to work for lower wages and under poor conditions, produced inevitable clashes. • Most Japanese entered agricultural work, first as laborers and eventually as tenant farmers or small landholders; other Japanese became contract gardeners on the estates of whites. • The Immigration Law of 1924 denied entry to specifically barred the Japanese because it denied entry to all aliens ineligible for citizenship.
Government Policies (continued) • By the late 19th century, labor supply exceeded demand, and laborers, union organizers, and demagogues mounted racist denunciation of Chinese “competition.” • 1941 - Japan’s attack on Pearl Harbor; and the subsequent war led to removal of 110,000 Japanese from their homes and placement in “relocation centers.” • Traditional Anti-Asian sentiment, opposition to Japanese agricultural business, and “fear” of the Japanese were underlining reasons for this expulsion. • National security was the primary justification. • The Supreme Court case, Endo v. United States, brought an end to this forcible detention.
Government Policies (continued) • The Evacuation Claims Act (1948) brought token repayment of about 10% of actual Japanese American losses. • Civil Rights Act, signed by Ronald Reagan, authorized reparation amounting to $20,000 tax free for surviving Japanese. The Filipino • 1898 - the Philippines became a U.S. possession; Filipinos came to the U.S. with a unique status as U.S. nationals there was no quota restriction on their entry until 1935. • 1908 - The Gentlemen’s Agreement curtailed Japanese emigration; the Hawaiian Sugar Planters’ Association recruited Filipinos to work the plantations.
Government Policies (continued) • Of every 100 Filipinos coming to California between 1920-1929, 93 were male. • 1924 - California growers, faced with the loss of Mexican labor because of quota restrictions in the Immigration Act recruited Filipinos. • Many young Filipino males went to urban areas seeking jobs. Discrimination, along with lack of education and job skills, resulted in their getting only low-paying domestic and personal service work in hotels, restaurants, other businesses, and residences. • Feeling that they were being exploited by their employers, Filipinos often joined unions (or formed their own unions when denied membership in existing unions) and went on strike, intensifying management resentment. Ironically, the union hierarchy also disliked them and later joined in efforts to bar Filipinos from the U.S.
Since the Immigration Act of 1965, Filipino immigration has been quite high. • About half of all Filipino Americans speak only English. • The largest concentration of Filipinos outside the Philippines is in Hawaii. The Koreans • Koreans arrived in substantial numbers after the Korean War and the Refugee Relief Act in 1953. The immigration law of 1965 opened the doors to Asian immigrants even more.
Almost 70% of the Korean American population identifies itself as Christian. • Nationwide, the 12% self-employment rate of Korean Americans is the highest of all ethnic or racial groups, including whites. • Ethnic churches make important contributions to Korean immigrant communities, serving more than religious purpose. The church becomes a social organization, providing religious and ethnic fellowship, a personal community, and a family atmosphere within an alien and urban environment. Korean American churches serve as a focal point for enhancing ethnic identity.
Koreans: Middleman Minority • The 12 percent self-employment rate of Korean Americans is the highest of all groups. In cities and exurbs, small Korean family-operated businesses are especially conspicuous. • In Los Angeles, they dominate the retail wig and liquor business. In D.C., Philadelphia, New York City, and Chicago, they are visible as grocery-store owners and fruit-stand operators. Others work as employees in these small stores and firms, which penetrate the black and Hispanic markets. • Because they occupy an intermediate position in trade and commerce between producer and consumer, Koreans are a middleman minority.
The Vietnamese • As the Vietnam War ended, Vietnamese refugees entered the U.S. • Immigration from Vietnam remains significant. • Contributing to Vietnamese immigrants’ adjustment problem was the federal government’s policy of scattering the refugees throughout the U.S. • Vietnamese have lower labor force participation, and median family incomes, higher poverty and unemployment rates, and disproportionate representation in low-skill, low-paying jobs, than most East Asian groups.
Other Southeast Asians • Of the approximately 1 million Indochinese Americans identified by the 2000 census • 24% were from Laos • 15% were from Cambodia (Kampuchea) • 61% were from Vietnam • 111,000 were from Thailand (formerly Siam)
Asian American Political Activist and Interest Groups Asian American Federation of Union Members (AAFUM) Asian American for Equality (AAFE) Asian American Legal Defense and Education Fund (AALDEF) Asian American Political Alliance (AAPA) Asian American Women for Equality (AWE) Asian Pacific American Coalition for Presidential Appointments (APACPA) Asian Pacific American Labor Alliance (APALA) Asian Pacific American Voters Project (APAVP) Asian Pacific Labor Alliance (APLA) Asian Pacific Voter Registration Project (APVRP) Asian Immigrant Women Advocates (AIWA) Association of Indians in America Chinese Progressive Association (CPA) Chinese Americans United for Self-Empowerment (CAUSE) Chinese American Voter Education Committee (CAVEC)
Asian American Political Activist and Interest Groups Chinatown Voter Education Alliance Chinese American Citizens Alliance Coalition of Asian Pacific Americans for Fair Representation (CAPAFR) Japanese Americans Citizens League (JACL) Korean American Coalition (KAC) Korean Immigrant Women Advocates (KIWA) Little Tokyo’s People’s Rights Organization (LTPRO) National Council of Japanese American Redress (NCJAR) Organization of Chinese Americans (OCA) Inter Ethnic Cooperation in Political Activism Black Korean Alliance (BKA) Latino and Asian Coalition to Improve our Neighborhood (LACTION)
Naturalization Rates by Years in U.S. and by Race, 1990 All immigrants (in thousands) 17,612 Naturalization rates by years in U.S. 0-10 years 15% 11-20 years 45 21 or more years 74 Naturalization rates by Race Non-Hispanic Whites 63% Blacks 36 Latinos 28 Asians 43 The naturalization rates did not decrease for Asian immigrants between 1970 to 1990
U.S.Supreme Court Cases affecting Americans of Asian Origin Yick Wo v. Hopkins, 118 U.S. 356 (1886) Takao Ozama v. United States, 260 U.S. 178 (1922) United States v. Bhagat Singh Thind, 261 U.S. 204 (1923) Hirabayashi v. United States, 320 U.S. 81 (1943) Korematsu v. United States, 323 U.S. 214 (1994) Oyama v. State of California, 332 U.S. 633 (1948) - California Alien Land Law of 1913 and 1920
Social Indicators About Asian-Americans (in percentage)