IRRIGATION SCHEDULING
IRRIGATION SCHEDULING. USDA-ARS. Crop ET PET Networks How to obtain & use information from the internet. Irrigation Technical Training. Texas SWCS Kerrville, Texas June 16, 1999. Irrigation Scheduling. Soil water balance soil / plant / atmosphere / water Irrigation system dynamics

IRRIGATION SCHEDULING
E N D
Presentation Transcript
IRRIGATIONSCHEDULING USDA-ARS • Crop ET • PET Networks • How to obtain & use information from the internet Irrigation Technical Training Texas SWCS Kerrville, Texas June 16, 1999
Irrigation Scheduling • Soil water balance • soil / plant / atmosphere / water • Irrigation system dynamics • efficiency / uniformity • Metering (control & feedback) • irrigation water / soil water / crop water
Crop ET Soil Water Balance Si = Si-1 + (P - Q) + (I - Q) - D - ET Si = “root zone” soil water on day i (P - Q) = “effective” precipitation (I - Q) = “effective” (net) irrigation D = percolation beneath the root zone ET = evaporation plus transpiration
Crop ET Soil Water Balance useinputs losses ET = SW + (I + P) - (D + Q) Some percolation (D) may be required for salinity leaching but can contain nutrients and agro-chemicals that are not desirable for the environment.
Soil Water • Spatial variability • crop • soil chemical properties • salinity • fertility • soil physical properties • infiltration & percolation • plant available soil water
Soil Water • Spatial variability (cont.) • precipitation • runoff & run-on • irrigation • runoff & run-on • hydraulics / operation dynamics
Evapotranspiration • ET = E + T E = evaporation T = transpiration E can depend on irrigation method and wetting frequency T is strongly correlated to crop dry matter
Maximum ET • Potential Evapotranspiration (PET) • basically goes back to Penman (1948) • not in “vogue” today, except in Texas • implies zero “bulk” surface resistance • wet crop • water surfaces
Reference Evapotranspiration • Applies to a specific crop • short grass (0.08 to 0.15 m tall; usually a cool-season type species like fescue, ryegrass, or bluegrass that doesn’t grow in most parts of Texas) … ETo • tall (>0.5 m tall) alfalfa (again, not a major crop in Texas) … ETr • well-watered (not deficient in soil water)
(Rn - G) + Wf (es - ea) ETo = ( + ) Penman Equation Wf = 6.43 (1 + 0.53 u2) … for short grass source Penman (1948)
Parameters • = des/T = f (air temperature) • [e*(T0) - e*(Ta)] / (T0 - Ta) • (barometric pressure or elevation) • (es - ea) = VPD = [es(Ta)] (1 - RH)
Modified Penman Equation • the wind function (Wf) is “fitted” • may vary on how VPD is computed • might apply to grass or alfalfa base depending on Rn and Wf e.g., FAO-24 Penman equation for grass
(Rn - G) + 86.4 Cp (es - ea) / ra ETo = [ + (1 + rs/ra) Penman-Monteith Equation • source Monteith (1965) rs = “bulk” surface resistance .... 70 s/m for grass .... 45 s/m for alfalfa ra = aerodynamic resistance K / u2
900 0.408 (Rn - G) + u2 (es - ea) T + 273 ETo = + (1 + 0.34 u2) FAO-56 PM Equation • source Allen et al. (1998) a slight simplification of the Penman- Monteith equation.
Important Resources 1990 1993 1998
PET • Most often in Texas, due to prior history and use, PET (potential evapotranspiration) is computed for a “grass reference” crop assuming many if not all the concepts in ASCE Manual No. 70, SCS (NRCS) Chapter 2, TWDB-98, or FAO-56.
Crop Coefficients • Single Kc approach ETc = Kco ETo (grass) or ETc = Kcr ETr(alfalfa) The “interchangeability” of Kc values depends on the ETo / ETr ratio or function.
Crop Coefficients • Dual crop coefficient approach ETc = (Kcbo + Ke) ETo ETc = (Kcbr + Ke) ETr Kcbo or cbr = “basal” Kco or cr (“dry” soil surface BUT “well-watered” crop ) Ke = soil water evaporation coefficient
Deficit Soil Water • Single Kc approach ETcadj = (Ks Kco) ETo ETcadj = (Ks Kcr) ETr • Dual Kc approach ETcadj = (Ks Kcbo + Ke) ETo ETcadj = (Ks Kcbr + Ke) ETr
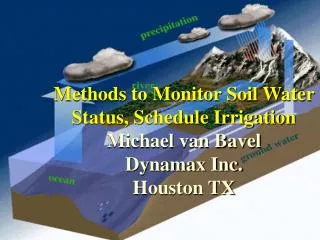
PET Networks • Provide “uniform” regional coverage with data to guide irrigation decision making • Educate irrigators and the public about irrigation water needs • Regional climate and weather data resource
Oklahoma Mesonet Texas Mesonet TxPET Network South Plains (Lubbock) North Plains (Amarillo) TAMU Network (CS) [ Coastal Bend (CC) ]
- PET Sites NP-PET Sites Dalhart Etter Morse Perryton Bushland White Deer Wellington Farwell Dimmitt Earth > 1,200 mi. for a circuit trip
Grass ET Measurement • Weighing lysimeter • 5 ft by 5 ft by 8 ft deep • Pullman clay loam monolith • SDI irrigated
Inside view of weighing lysimeter 1995 Soybean Crop 3 m Measuring Crop ET
Crop Information • Crops • corn, sorghum, wheat, cotton, soybean, peanut • Sowing Dates • 4 dates that bracket typical practices • Hybrids / Varieties / Cultivars • full-season and short-season for sorghum and corn
NP-PET Information • “Well-watered” crops • “Normal” crops without diseases or pest problems • Daily, 3-day, 7-day, seasonal ET rates • Predicted crop development stage for each crop (& hybrid type) and sowing date
NP-PET Information ... • Daily GDDs and GDD sums for each crop (& hybrid type) and sowing date • 3-day climate summary • rainfall, air temperature, soil temperatures, and PET • Alerts and messages (regional pest information, news, upcoming events)
NP-PET Users • Growers / Irrigators / Farm Managers • Production Consultants & Advisors • Agricultural Industries • Agronomists / Agricultural Engineers • Researchers • Extension Personnel • Water District & Regulatory Personnel • Design Personnel & Consultants • Meteorologists / Climatologists
NP-PET Goals • Provide accessible “generalized” data of consistent quality and reliability • Provide wide-area data for private consultants and crop advisors in near “real-time” so that tailored client products can be developed
How is the NP-PET Information Disseminated ? • Daily fax to subscribers (350+ per night) • Internet Web site
Fax Recipients • Subscribed Growers / Irrigators • Crop Consultants • Local Cooperatives • Newspapers • News Stations: Radio & TV
WWW Users • Production Personnel - (own models) • Consultants - (own models) • Researchers / Modelers - (water, insect, disease, air, dust modeling development) • Extension Personnel • Texas Mesonet (possibility ??)
Grass ET Estimates • PET data are useful for estimating urban lawn water needs • TAEX Master Gardener Program • Water Smart Program • Municipal / Schools / Golf Course irrigation decisions
How do you use the information ? Requires training, requires experience, and requires some local data (rainfall, irrigation, cropping information .....) • Rainfall data • field basis • Irrigation data • field applications
How do you use the information ? ... • System capacity — gpm/ac or in./d or an estimate of ‘application efficiency’ • Crop data • Planting date • Type of hybrid for corn or sorghum
1.2 in. @ 6 gpm/ac 1.8 in. @ 5 gpm/ac } 2.6 in. @ 4 gpm/ac 6 gpm/ac 5 gpm/ac 4 gpm/ac
What Value is the PET Information ? • Provides useful regional information • rainfall • soil temperatures (planting guides) • data are being used in pest models • quantifies water needs • indicates crop development rates
What Value is the PET Information ? ... • Water savings • could reduce pumping costs by $2-5,000 for a 1,000 ac irrigated farm by saving only 1 inch of water • Avoid uncertainties in climatic damages • late spring freezes on wheat
What Value is the PET Information ? ... • LOOK at the PET data as a valued “new tool” or accessory • keep maintaining accurate records • keep doing plant and soil water sampling • keep monitoring irrigation system performance
PET Tools • Can be used as a periodic guide post (twice a week or so) to see if you are applying enough water • Provides crop consultants uniform data that they can utilize for customer portfolios
NP PET Webhttp://amarillo2.tamu.edu/nppet/petnet1.htm Data: by station 10-current 9 archived fax pages hourly data
SP (Lubbock) PEThttp://achilleus.tamu.edu/ Lubbock, Lamesa, & Halfway Current PET & GDD Archived data: Lubbock since 1994 Lamesa since 1996 Halfway since 1996
Texas EvaporanspirationWeb Sitehttp://www.agen.tamu.edu/wqit/petnet/ 20 stations some with data back to late 1996. Interactive water use calculator, Kc data, etc.
Other Examples High Plains Climate Center Univ. of Nebr. http://hpccsun.unl.edu/
Models / Data Sites • New Mexico State Climate Center • http://weather.nmsu.edu/ • ET Models (Silsoe College in England) • http://spider.silsoe.cranfield.ac.uk/mig/ SilsoeModels.htm • SWIM v2 (CSIRO Australia) • http://www.clw.csiro.au/products/swim/ index.htm