Download

1 / 33
330 likes | 440 Vues
Obesity Disparities, Prevention and Control in Underserved Urban Communities. Antronette K (Toni) Yancey, MD, MPH, FACPM Professor of Health Services, Co-Director, Center to Eliminate Health Disparities UCLA School of Public Health www.ph.ucla.edu/cehd www.toniyancey.com.

E N D
Obesity Disparities, Prevention and Control in Underserved Urban Communities Antronette K (Toni) Yancey, MD, MPH, FACPM Professor of Health Services, Co-Director, Center to Eliminate Health Disparities UCLA School of Public Health www.ph.ucla.edu/cehdwww.toniyancey.com
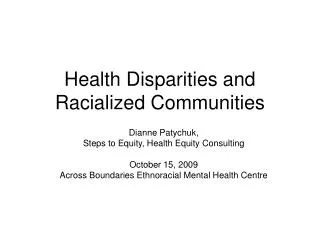
Adult Obesity: 1988-94 to 1999-2000 Race/Ethnicity 1988-94 Target Total White Female Male Black Female Male Mexican American Female Male 0 10 20 30 40 50 Percent Note: Data are for ages 20 years and over, age adjusted to the 2000 standard population. Obesity is defined as BMI >= 30.0. Black and white exclude persons of Hispanic origin. Persons of Mexican-American origin may be any race. Source: National Health and Nutrition Examination Survey, NCHS, CDC. Obj. 19-2
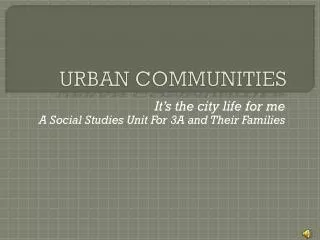
Prevalence of Obesity among LAC Adults by Ethnicity, 1997-2005
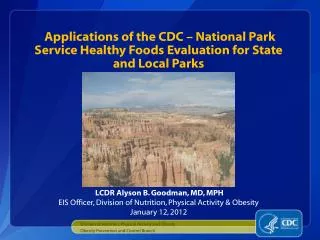
Growth in Childhood Obesity Disparities1984-88 (bottom) to 2003-04 (top)
Type 2 Diabetes Incidence Among Adolescents • 1982: 0.7 / 100,000 per year • 1994: 7.2 / 100,000 per year • 2004: 13.9-16.0 / 100,000 per year >20-fold increase Sources: Pinhas-Hamiel O et al. J Pediatr 1996;128:608-15 Daniels et al, Circulat 2005;111;1999-2012
?Influence on Life Expectancy • For the first time in thousands of years, this generation of children may live shorter lives than their parents* • Chances of developing diabetes at birth for African-American and Latino children is about twice that of white children (1 in 2 vs. 1 in 4)** *Olshansky et al., NEJM 2005;352(11):1138-45 ** Daniels et al, Circulat 2005;111;1999-2012
Staying healthy is easier for some than for others… UPPER SES LOWER SES Education College GED or HS Housing Own / Safe Rent / Safe? Physical activity Gyms /Parks Parks?, “move insecure” Advertising Sparse Pervasive Neighborhood stores Fruit/Veg, food secure Drugs/Alcohol, food insecure Police Helpful Abusive Healthcare Private Doc ER, VA Sick leave Accrued None Leisure priority Exercise Rest Work conditions Safe, hi decis. lat., Hazardous, lo decis. lat., no +flex time no flex time Child care Nanny/hi-qual facil. Family/neighbor, lo-qual facil. Elder/disabled care HHW/hi-qual facil. Family/neighbor, lo-qual facil. Criminal just. sys. Little contact Much contact Premature M&M Low High
targeted/exploitative marketing excess fast food outlets few supermarkets limited healthful shelf choices & poorer quality produce highly-processed food culturally embraced (home, church) poorer public/less private transportation distance to private fitness facilities few worksite fitness opportunities few/poor neighborhood recreation facilities lesser neighborhood safety poorer public/less private transportation Adapted from Kumanyika S. Obesity in Minority Populations. In Fairburn G & Brownell K, Eating Disorders and Obesity. A Comprehensive Handbook, 2002. Excess physical environmental risk in underserved communities:
low neighborhood demand for healthy food choices low family incomes other household expenses little homegrown food, nor yard space for gardens financial incentives for under-resourced schools by commercial vendors, e.g., “pouring rights” soda contracts limited investment in parks/rec. facilities fitness facility fees cost of exercise equipment less stable employment patterns fewer trained PE instructors large, overcrowded PE classes poorly equipped facilities Excess economic environmental risk in underserved communities:
traditional cuisine fasting-feasting prevalent obesity higher norms body image female roles (perceived) food insecurity cultural attitudes about PA, rest fears about safety female roles cultural reverence for cars, esp. among upwardly mobile hairstyle-related concerns about sweating, esp. teens higher levels of TV viewing Excess sociocultural environmental risk in underserved communities:
Shift in health promotion field (Spectrum of Prevention) The most effective and sustainable public health approaches of the past 2 decades are the more “upstream” ones (structural/environmental vs. individual-level), involving social norm change: • Tobacco control • Alcohol consumption and driving • Littering & recycling • Seat belt & child safety seat usage
Population Obesity Control Environmental Change Policy: Early stage in development Strategically, why shift focus to PA promotion? • Less controversy, conflict, stigma than surrounding diet/nutrition • “Deep pocket” business interests, e.g., Nike & 24-Hour Fitness, stand to benefit from success of efforts (vs. “Big Food” losing $ because can’t as readily induce over-consumption of H2O, whole grains, legumes, F+V) • Cheaper & easier—10 min. supply 1/3 of PA “RDA” • May positively influence food preferences
Build on Cultural Assets Integrating 10-’ PA into organizational routine: • Movement to music integral to many cultures—dancing normative for adults • Short bouts minimize perspiration & hairstyle disturbance—enjoyable by unfit to very fit folks • Social support & conformity desires drive participation (collectivist vs. indiv. orientation) • Addresses less activity conducive outdoor environments (safety, utility, aesthetics) • Designed for organizational settings for work, worship, etc.-- folks have less disposable time, $
Lift Offs Work!:the Rapidly Growing Evidence Base • Documented individual and organizational receptivity to integrating PA on paid work time • Contribute meaningfully to daily accumulation of MVPA • Motivational “teachable moment” linking sedentariness to health status for inactive folks • Improvements in clinical outcomes from as little as one 10-min. break/day—BP, BMI, waist circ., mood, attention span, cumulative trauma disorders • “Spill-over” or generalization to inc. active leisure • Favorable cost-benefit ratio, eg, L.L. Bean mfg plant
Recapturing Recess*:A model for physical activity promotion in diverse communities Lessons from recess apply to PA promotion: • Institutionalized—part of the structure of the organization • Social event/social support/peer modeling/ peer pressure/social sanctions • Fun! • Facilities provided—convenient, accessible • Carry-over to other venues • Cultural congruence of activities *Yancey, Am J Prev Med 1998;15(4):iv.