Investment Research Challenge
370 likes | 548 Vues
Investment Research Challenge. Presented by: Matthew Henderson Ethan Hendrickson Chaz Johnson Shawn McFarland. Boise Inc. Products. Corrugated Containers. Label & Release. Imaging Papers. Containerboard. Overview. Company and industry profile Investment highlights Valuation

Investment Research Challenge
E N D
Presentation Transcript
Investment Research Challenge Presented by: Matthew Henderson Ethan Hendrickson Chaz Johnson Shawn McFarland
Boise Inc. Products Corrugated Containers Label & Release Imaging Papers Containerboard
Overview • Company and industry profile • Investment highlights • Valuation • Financial analysis • Investment risks • Recommendation and conclusion
Paper Industry Overview • Highly cyclical • Consolidation & decline • Top 5 producers have 80% share UFS Market Balance
Packaging Industry Overview • Cyclical with the macro economy • Growth opportunities • High vertical integration via industry consolidation • Boise Inc. acquired Tharco and Hexacomb in 2011 • Increased packaging vertical integration to 92% from 69%
Company Profile • Went public in February 2008 • 3rd largest UFS manufacturer in North America • 11% share • 8th largest containerboard manufacturer in North America • 2 % share
Company Profile • Strategic shift to packaging
Investment Highlights • Boise Inc. is fully valued • DCF value $8.29 vs. stock price $8.11 • EV/EBITDA12 5.4x vs. Industry 5.3x • Returning capital to investors • Share repurchase program/special dividends • Debt reductions • Packaging growth: Tharco and Hexacomb acquisitions • Exposure to macroeconomic conditions
DCF Valuation WACC Assumptions • We employed the FCF to the firm DCF method • Cost of equity: 10.9% • Risk-free rate 2.1% (10-year T-bond) • Market risk premium 5.5% (survey data) • Beta 1.6 (Bloomberg 2 year estimate) • Cost of debt: 8.3% • After-tax WACC: 8.2%
Returns and Cash Flow • Lower ROIC due to elevated relative SG&A costs • Lower economies of scale • ROIC 6.6% vs. 13.7% for peers in 2010 • Surplus free cash flow • CFFO $290M • CAPEX $112M • Debt reductions • Stock repurchase program • Special dividends
Liquidity and Leverage • Liquidity is average • Current & quick ratios are roughly industry average • $600M in senior note maturities extended to 2017 and 2020 • Low usage of $250M revolving line of credit • Decreasing leverage • Recently reduced debt to capital ratio • Cash flow flexibility sufficient to continue debt reduction • BB credit rating by S&P
Investment Risks • Increasing shift to paper alternatives • Dependent upon OfficeMax for 25% of sales • Contract renewed through 2017 • Volatile input costs (fiber, chemicals, & energy) • Cyclical exposure to macroeconomic conditions
Recommendation • $8.29 price target • February 17, 2012 closing price: $8.11 • Hold Recommendation
Appendix Acquisitions Beta Calculations Cost of Equity Calculation Discounted Cash Flow Assumptions EBITDA Sensitivity Analysis Executive Compensation Historical Stock Prices Operating Leases Packaging Shift Pension Obligations Price/Book Details Relative Valuation Assumptions
Back to Appendix Tharco and Hexacomb Acquisitions • Tharco: $201M (March 2011) • $261M sales; $27M EBITDA (adjusted) • Value-added products • $8M estimated annual synergies (within 18 months) • Hexacomb: $125M (December 2011) • $110M sales; $15M EBITDA (adjusted) • >10% compound annual growth rate • Diversification into protective packaging • $5M estimated annual synergies (within 24 months) • Risk: High purchase price, increase in 2011 SG&A due to integration
Back to Appendix Beta Calculations
Back to Appendix Cost of Equity Calculation • 2.1% Risk free rate • Using the 10 year T-bond yield • 5.5% Market risk premium • Historical average • Recent survey data (May 2010) • 1.6 Beta • Bloomberg adjusted 2 year estimate • Calculation • 2.1 + 5.5(1.6) = 10.90%
Back to Appendix EBITDA Sensitivity Analysis From Boise Inc. Investor Presentation, December 2011, page 19
Back to Appendix Discounted Cash Flow Assumptions • Sales Growth • 3% terminal year growth • ROIC • Growing from 7.8% to 9.0% in the terminal year • Will eventually exceed WACC. • Cost of Equity – 10.90% • Cost of Debt – 8.3% • Includes yield on long-term debt and revolving bank credit
Back to Appendix Executive Compensation
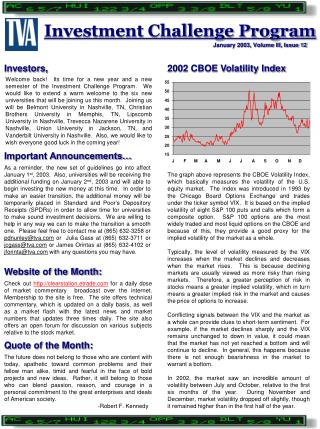
Back to Appendix Historical Stock Prices 3 Months 1 Year 2 Year 5 Year
Back to Appendix 5 Year Historical Prices
Back to Appendix 2 Year Historical Prices
Back to Appendix 1 Year Historical Prices
Back to Appendix Recent Performance Has Diminished Discount to the Industry
Back to Appendix Long Term Operating Leases Source: 2011 10K, page 44
Back to Appendix Packaging Shift Details From Boise Inc. Investor Presentation, December 2011, page 3
Back to Appendix Pension Obligations • Estimated minimum contributions are at least $20M in 2012 and $24M in 2013.
Back to Appendix Price/Book • FASB 805-20-30-1 • “The acquirer shall measure the identifiable assets acquired, the liabilities assumed, and any non-controlling interests in the acquiree at their acquisition-date fair value” (Italics added)
Back to Appendix Relative Valuation Assumptions • Weighted each of the industry peer segments by Boise Inc.’s operating income share • 53% paper and 47% packaging • 5.1x paper and 5.5x packaging EV/EBITDA • .53*(5.1x) + .47*(5.5x) = 5.3x industry average • Boise Inc.’s EV/EBITDA • Enterprise Value/EBITDA • 1,640,980 / 304,519 = 5.4x Boise Inc.