Download

1 / 80
910 likes | 1.15k Vues
Behavioral Economics and Economic Policy Robert H. Frank Cornell University Johnson Graduate School of Management. Adam Smith’s invisible hand: Self-interested demands will result in a socially efficient allocation. Why do markets often fail?. Which world would you choose?.

E N D
Behavioral Economics and Economic Policy Robert H. Frank Cornell University Johnson Graduate School of Management
Adam Smith’s invisible hand: Self-interested demands will result in a socially efficient allocation.
Which world would you choose? World A: You and your family live in a neighborhood with 4000-square-foot houses, others in neighborhoods with 6000-square-foot houses. World B: You and your family live in a neighborhoods with 3000-square-foot houses, others in neighborhoods with 2000-square-foot houses.
Which world would you choose? A: You have 4 weeks of vacation each year, others have 6 weeks? or B: You have 2 weeks of vacation each year, others have 1 week?
Housing = positional good Leisure = nonpositional good
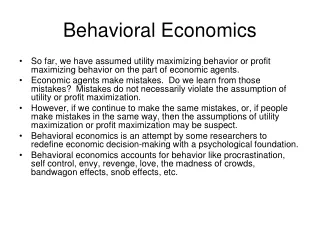
People care about relative consumption, more in some domains than in others. • 2. Such concerns lead to positional arms races--expenditure arms races focused on positional goods. • 3. These arms races divert resources from nonpositional goods, causing large welfare losses. • 4. The welfare losses have been made worse by rising income inequality.
The Conflict Between Individual and Group Robert H. Frank.“The Demand for Unobservable and Other Nonpositional Goods.” American Economic Review, 75, March, 1985, pp. 101-116.
Charles Darwin: Traits are selected because of their impact on the reproductive fitness of individuals, not groups. Traits that benefit individuals often work to the disadvantage of groups.
Happiness and Income (Easterlin,1974) 1. Happiness levels within a country tend to be highly stable over time, even in the face of significant economic growth. Veenhoven, 1993
2. Happiness within countries at any moment of time depends on income. Income vs Satisfaction in the US, 1981-4. Source: Diener, Sandvik, and Seidlitz, 1993.
Theoretical Considerations People should care about relative position because it affects material payoffs • Food in Famines • Mate access
Neurophysiological Evidence • Local rank vs serotonin
Probability that Sister A is employed is 16-25% higher when Sister B’s husband earns more than Sister A’s husband. Source: Neumark and Postlewaite, 2000
In a poor country, a man proves to his wife that he loves her by giving her a rose. In a rich country he must give a dozen roses. Richard Layard
The middle class family’s condition has grown more difficult because of sharply rising inequality of income and wealth.
Fractal earnings change pattern for virtually every labor market group: Bottom quintile: Absolute earnings decline Middle quintile: Negligible earnings growth Top quintile: Substantial growth
College graduates Dentists The top 1 percent The top 1/10th of 1 percent…
Earnings of CEOs of largest U.S. corporations 1980: 42 x average worker’s earnings 2000: 531 x average worker’s earnings
Why increased inequality? Changes in the distribution of human capital? Foreign competition at the low end? Technical change favoring most educated workers?
Winner-Take-All Markets Markets in which reward depends not just on absolute performance but also on relative performance.
The market for university presidents Suppose Cornell’s Skorton was 3% better at fundraising than the 2nd-best candidate. Bottom-line difference: (0.03)x($4 billion) = $120 million
Not all costs of inequality are psychological. Because of increased inequality, it now costs a middle-class family much more than before to achieve many important goals.
If you were society’s median earner, which option would you prefer? • You save enough to support a comfortable standard of living in retirement, but your children attend a school whose students score in the 20th percentile on standardized tests in reading and math; or 2) you save too little to support a comfortable standard of living in retirement, but your children attend a school whose students score in the 50th percentile on those tests?
The cost of sending a child to a school of average quality is linked to the price of the average house in the community. Median size of a newly constructed house: 1980: less than 1600 square feet 2007: more than 2300 square feet
Expenditure Cascades • Top earners spend more because they have more money. • This shifts frame of reference for those just below them, who also spend more. • That, in turn, shifts the frame of reference for those next below. • And so on all the way down the income ladder.
$10 million birthday parties 50 Cent Aerosmith
Gas Grills Then and Now 1989 Sunbeam, $90 Viking Professional, $5,000.
Evidence for Expenditure Cascade Hypothesis Large U.S. counties with higher growth in 90/50 ratios* had higher growth in Commute times • Divorce rates • Bankruptcy rates In OECD, over time and across countries, higher 90/50 ratios are linked with longer hours of work***Frank, Levine, and Ostvik-White, 2004**Bowles and Park, 2003
Why do hockey players vote in secret ballots for helmet rules, even though they choose not to wear helmets when there is no rule?
If you were society’s median earner, which option would you prefer? A. You work in a safe job, but your children attend a school whose students score in the 20th percentile on standardized tests in reading and math; or B. You earn a higher salary by accepting a more dangerous job, but your children attend a school whose students score in the 50th percentile on those tests?
Proposed positional arms control agreement: Impose limits on workplace safety risks.