Lisa Short Course Series R Statistical Analysis
210 likes | 371 Vues
Laboratory for Interdisciplinary Statistical Analysis. Lisa Short Course Series R Statistical Analysis. Laboratory for Interdisciplinary Statistical Analysis. LISA helps VT researchers benefit from the use of Statistics. Collaboration:

Lisa Short Course Series R Statistical Analysis
E N D
Presentation Transcript
Laboratory for Interdisciplinary Statistical Analysis Lisa Short Course SeriesR Statistical Analysis
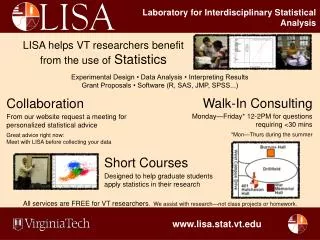
Laboratory for Interdisciplinary Statistical Analysis LISA helps VT researchers benefit from the use ofStatistics Collaboration: Visit our website to request personalized statistical advice and assistance with: Experimental Design • Data Analysis • Interpreting ResultsGrant Proposals • Software (R, SAS, JMP, SPSS...) LISA statistical collaborators aim to explain concepts in ways useful for your research. Great advice right now: Meet with LISA before collecting your data. Short Courses:Designed to help graduate students apply statistics in their research Walk-In Consulting: M-F 1-3 PM GLC Video Conference Room; M 3-5 PM 312 Sandy; T 11-1PM Port; W 11-1PM Old Security Building. For questions requiring <30 mins All services are FREE for VT researchers. We assist with research—not class projects or homework.
Laboratory for Interdisciplinary Statistical Analysis Outline • Review of plots • T-test 2.1 One sample t-test 2.2 Two sample t-test 2.3 Paired T-test 2.4 Normality Assumption & Nonparametric test • ANOVA 3.1 One-way ANOVA 3.2 Two-way ANOVA • Logistic Regression
Laboratory for Interdisciplinary Statistical Analysis Review of plots • Using visual tools is a critical first step when analyzing data and it can often be sufficient in its own right! • By observing visual summaries of the data, we can: • Determine the general pattern of data • Identify outliers • Check whether the data follow some theoretical distribution • Make quick comparisons between groups of data
Laboratory for Interdisciplinary Statistical Analysis Review of plots • plot(x, y) (or equivalent plot(y~x)) scatter plot of variables x and y • pairs(cbind(x, y, z)): scatter plots matrix of variables x, y and z • hist(y): histogram • boxplot(y): boxplot • lm(y~x): fit a straight line between variable x and y
Laboratory for Interdisciplinary Statistical Analysis Review of plots • Low Birth Weight Data Description (lowbwt.csv) (189 observations, 11 variables) • ID: Identification Code • LOW: Low Birth Weight (0 = Birth Weight >= 2500g, 1 = Birth Weight < 2500g) • AGE: mother’s age in years • LWT: mother’s weight in lbs • RACE: mother’s race (1 = white, 2 = black, 3 = other) • SMOKE: smoking status during pregnancy • PTL: no. of previous premature labors • HT: history of hypertension • UI: presence of uterine irritability • FTV:no. of physician visits during first trimester • BWT: Birth Weight in Grams
Laboratory for Interdisciplinary Statistical Analysis T-Test 2.1 One sample t-test Research Question: Is the mean of a population different from the null hypothesis (a nominal value, or some hypothesized value)? Example: Testing whether a baby's average birth weight is different from 2500 g. Hypotheses: Null hypothesis: the baby's average birth weight is 2500 g Alternative hypothesis: the baby's average birth weight is not equal to(or greater/less than) 2500 g In R: t.test(x, y = NULL, alternative = c("two.sided", "less", "greater"), mu = 0, paired = FALSE, var.equal = FALSE, conf.level = 0.95)
Laboratory for Interdisciplinary Statistical Analysis T-Test 2.2 Two sample t-test Research Question: Are the means of two populations different? Example: Consider whether the birth weight of these babies whose mothers smoke is different form those whose mothers don’t smoke ? Hypotheses: Null hypothesis: the average birth weight of the babies whose mothers smoke equals to the babies’ average birth weight whose mothers don’t smoke Alternative hypothesis: the babies’ average birth weight of smoking mothers is not equal to (or greater/less than) that of non-smoking mothers In R: t.test(BWT~SMOKE) t.test(BWT~SMOKE,var.equal=T)
Laboratory for Interdisciplinary Statistical Analysis T-Test 2.3 Sample size calculation Research Question: How many observations are needed for a given power, or what is the power of the test given a sample size? Power = probability rejecting null when null is false In R: power.t.test(n = NULL, delta = NULL, sd = 1, sig.level = 0.05, power = NULL, type = c("two.sample", "one.sample", "paired"), alternative = c("two.sided", "one.sided"), strict = FALSE) Calculate a sample size given a power: power.t.test(delta=2,sd=2,power=.8) Calculate a power given a sample size : power.t.test(n=20, delta=2, sd=2)
Laboratory for Interdisciplinary Statistical Analysis T-Test 2.4 Paired T-test Research Question: Given the paired structure of the data are the means of two sets of observations significantly different? Example:In a warehouse, the employees have asked management to play music to relieve the boredom of the job. The manager wants to know whether efficiency is affected by the change. The table below gives efficiency ratings of 15 employees recorded before and after the music system was installed. (Link of the dataset: http://www-ist.massey.ac.nz/dstirlin/CAST/CAST/HtestPaired/testPaired_c1.html) In R: t.test(efficiency_after,efficiency_before,paired=T) or, t.test(diff), diff= efficiency_after-efficiency_before
Laboratory for Interdisciplinary Statistical Analysis T-Test 2.5 Checking assumptions & Nonparametric test Using t-test, we assume the data follows a normal distribution, to check this normal assumption: visualization and statistical test. Visualization Histogram: shape of normal distribution: symmetric, bell-shape with rapidly dying tails. QQ-plot: plot the theoretical quintiles of the normal distribution and the quintiles of the data, straight line shows assumption hold. Statistical Test: Shapiro-Wilk Normality Test In R: shapiro.test(data)
Laboratory for Interdisciplinary Statistical Analysis T-Test 2.5 Checking assumptions & Nonparametric test When the normal assumption does not hold, we use the alternative nonparametric test. Wilcoxon Signed Rank Test Null hypothesis: mean difference between the pairs is zero Alternative hypothesis: mean difference is not zero In R: wilcox.test(x, y = NULL, alternative = c("two.sided", "less", "greater"), mu = 0, paired = FALSE, exact = NULL, correct = TRUE, conf.int = FALSE, conf.level = 0.95, ...)
Laboratory for Interdisciplinary Statistical Analysis T-Test 2.5 Checking assumptions & Nonparametric test When the normal assumption does not hold, we use the alternative nonparametric test. Wilcoxon Signed Rank Test Null hypothesis: mean difference between the pairs is zero Alternative hypothesis: mean difference is not zero In R: wilcox.test(x, y = NULL, alternative = c("two.sided", "less", "greater"), mu = 0, paired = FALSE, exact = NULL, correct = TRUE, conf.int = FALSE, conf.level = 0.95, ...)
Laboratory for Interdisciplinary Statistical Analysis ANOVA- Analysis of Variance T-test: Compare the mean of a population to a nominal value or compare the means of equivalence for two populations What if you want to compare the means of more than two populations? We use ANOVA! One-Way ANOVA: Compare the means of populations where the variation are attributed to the different levels of one factor. Two-Way ANOVA: Compare the means of populations where the variation are attributed to the different levels of two factors.
Laboratory for Interdisciplinary Statistical Analysis ANOVA- Analysis of Variance 3.1 One-way ANOVA Example: Compare the BWT(birth weight in grams) for 3 races bwt data: BWT: gams RACE: mothers’ race (1 = White, 2 = Black, 3 = Other) SMOKE: mothers’ smoking status during pregnancy (1 = Yes, 0 = No) Hypothesis: Null hypothesis: the three groups have equal average birth weight Alternative hypothesis: at least two groups do not have equalbwt In R: a.1=aov(BWT~factor(RACE)) and summary(a.1)
Laboratory for Interdisciplinary Statistical Analysis ANOVA- Analysis of Variance 3.2 Two-way ANOVA Example: Compare the bwt for 3 races and 2 status of smoking Three effects to be considered: RACE, SMOKE and the interactions In R: a.2 = aov(BWT~factor(SMOKE)*factor(RACE)) and summary(a.2)
Laboratory for Interdisciplinary Statistical Analysis LOGISTIC Regression
Laboratory for Interdisciplinary Statistical Analysis LOGISTIC Regression
Laboratory for Interdisciplinary Statistical Analysis LOGISTIC Regression Example: Low birth weight data We are interested in understanding the variables that predict the likelihood of a mother giving birth to a baby with low-birth weight (defined as a baby weighing less than 2500 grams). The response variable: low: 0, 1 (Indicator of birth weight less than 2.5 kg) The predict variables: • age: mother’s age in years • lwt: mother’s weight in lbs • race: mother’s race (1 = white, 2 = black, 3 = other) • smoke: smoking status during pregnancy • ptl: no. of previous premature labors • ht: history of hypertension • ui: presence of uterine irritability • ftv: no. of physician visits during first trimester
Laboratory for Interdisciplinary Statistical Analysis LOGISTIC Regression
Laboratory for Interdisciplinary Statistical Analysis Thank you! Please don’t forget to fill the sign in sheet and to complete the survey that will be sent to you by email.