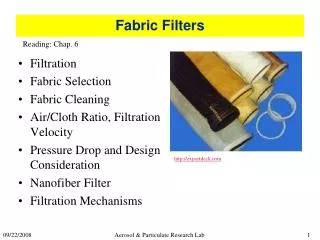
Why fine filtration?
Diversity of the eukaryotes and prokaryotes (including plastids) assemblages assessed from fine size fractionation and DGGE. Why fine filtration?. 1- Because we obtained a lot of clones that are known to belong to organisms

Why fine filtration?
E N D
Presentation Transcript
Diversity of the eukaryotes and prokaryotes (including plastids) assemblages assessed from fine size fractionation and DGGE
Why fine filtration? 1- Because we obtained a lot of clones that are known to belong to organisms larger than the picoplanktonic fraction (copepods, dinoflagellates, ....) 2- Because we wanted to check whether the 0.2 - 3 µm fraction describes accurately the picoplankton. 3- To assess the size of unculturable organisms such as novel alveolates, or stramenopiles which we have found majoritary in the clone libraries.
Filtering chain Pump Filters with decreasing sizes Natural sample 1- The filters must not saturate 2- But, they must have enough biomass to extract good-quality DNA 3- The lenght of the filtering chain must be as short as possible to minimize cell disruption.
Barcelona Harbour (from May 2000 up to now) Parameters bimonthly sampled: Flow cytometry Phytoplankton (Uterhmol method) virus (Pulse-field-electrophoresis) Temperature Salinity Secchi disk Chl a PO4 NH4 NO2 NO3 Si Extracted DNA : >3 µm, <3 µm
28/02/2001 Cells per Litre 0.5 µm 0-20 µm > 15 µm
Barcelona Harbour 28/02/2001 1 L 0.8 L CHAIN 1 Prefiltration on 10.0 µm 1.0 0.6 0.2 4 L CHAIN 2 Prefiltration on 20.0 µm 10.0 3.0 1.0 CHAIN 3 12 L 20.0 14.0 10.0
PCR amplifications Eukaryotes (1F/516R-GC) 0.2- 0.6 0.6- 1.0 1.0- 10.0 3.0- 5.0 5.0- 10.0 >10.0 10.0- 14.0 14.0- 20.0 >20.0 >10.0 >20.0 - prefiltrations Chain 1 Chain 2 Chain 3 Prokaryotes (GC-358F/907R) : all fractions amplified Archaea (GC-344F/915R) : No amplifications.
Results on DGGE, Eukaryotes 45% 65% 1.0- 10.0 10.0- 20.0 10.0- 14.0 14.0- 20.0 5.0- 10.0 3.0- 5.0 0.6-1.0 > 20.0 10.0 - 20.0 1.0 - 10.0
Results on DGGE, Prokaryotes 40% 80% 1.0- 10.0 3.0- 5.0 5.0- 10.0 10.0- 14.0 14.0- 20.0 0.2-0.6 0.6-1.0 > 20.0
Next steps • The size fractionation will be reduce in the smallest size class : • 0.2, 0.6, 1.0, 2.0, 3.0, 5.0, 10.0 ... • I am now comparing these results with other ecosystems such as • - the Blanes site (March 2001) • - the Barcelona Harbour (March 2001) • ... and perhaps deth sample from the Canyon cruise (Juny 2001) • A study of the diversity in the smallest size classes will be done by direct sequencing of the bands and/or clone library. • Calibrated the size fractionation with the “real size” of the organisms obtained from cultures.