Download
1 / 44
450 likes | 927 Vues
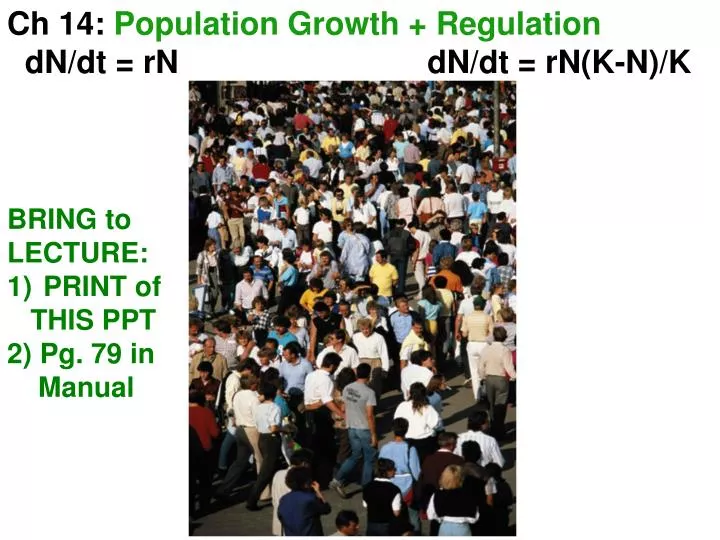
Ch 14: Population Growth + Regulation dN/dt = rN dN/dt = rN(K-N)/K. BRING to LECTURE: PRINT of THIS PPT 2) Pg. 79 in Manual. Objectives. Population Structure Population Dynamics Growth in unlimited environment

E N D
Ch 14: Population Growth + Regulation dN/dt = rN dN/dt = rN(K-N)/K • BRING to • LECTURE: • PRINT of THIS PPT 2) Pg. 79 in Manual
Objectives Population Structure Population Dynamics • Growth in unlimited environment • Geometric growth Nt+1 = Nt • Exponential growth Nt+1 = Ntert • dN/dt = rN • Model assumptions • Growth in limiting environment • Logistic growth dN/dt = rN (K - N)/ K • D-D birth and death rates • Model assumptions
Population: all individuals of a species in an area Subpopulations: in different habitat patches *** What are structures (traits) of populations? • Size (abundance) • Age structure • Sex ratio • Distribution (range) • Density (#/unit area) • Dispersion (spacing) • Genetic structure
***Draw two graphs of population growth showing: Growth with unlimited resources Growth with limited resources Label axes. Indicate carrying capacity (K). 3) What are equations representing both types of growth: A) exponential? B) logistic?
Population growth predicted by the exponential (J) vs. logistic (S) model.
Population growth can be mimicked by simple mathematical models of demography. • Population growth (# ind/unit time) = recruitment - losses • Recruitment = *** • Losses = *** • Growth (g) = *** • Growth (g) = (B - D) (in practice)
Two models of population growth with unlimited resources : • Geometric growth: • Individuals added at one time of year (seasonal reproduction) • Uses *** • Exponential growth: • individuals added to population continuously (overlapping generations) • Uses *** • Both assume ***
Difference model for geometric growthwith finite amount of time • ∆N/ ∆t = rate of ∆ = *** • where b = finite rate of birth or per capita birth rate/unit of time • g = b-d, gN = ***
Projection model of geometric growth (to predict future population size) • Nt+1 = Nt + gNt • =(1 + g)Nt Let (lambda) = *** • Nt+1 = Nt • = *** • Proportional ∆, as opposed to finite ∆, as above • Proportional rate of ∆ / time • = finite rate of increase, proportional/unit time
Geometric growth over many time intervals: • N1 = N0 • N2 = N1 = · · N0 • N3 = ***= *** • Nt = t N0 • Populations grow by multiplication rather than addition (like compounding interest) • So if know and N0, ***
Example of geometric growth (Nt = t N0) • Let =1.12 (12% per unit time) N0 = 100 • N1 = 1.12 x 100 112 • N2 = *** 125 • N3 = *** 140 • N4 = *** 157
Geometric growth: > 1 and g > 0 N N0 = 1 and g = 0 < 1 and g < 0 time
Values of , r, and Roindicate whether population is: *** Ro < 1 Ro =1 Ro >1
Differential equation model of exponential growth:*** rate of contribution number change of each of in = individual X individuals population to population in the size growth population
dN / dt = r N • r = *** • Instantaneous rate of birth and death • r = (b - d) so r is analogous to g, but instantaneous rates • rates averaged over individuals (i.e. per capita rates) • r =***
E.g.: exponential population growth = 1.04
Exponential growth:Nt = *** r > 0 • Continuously accelerating curve of increase • Slope varies directly *** • (N) (gets steeper as size increases). r = 0 r < 0
Environmental conditions and species influence r, the intrinsic rate of increase.
Population growth rate depends on the value of ***; ***is environmental- and species-specific.
Value of r is unique to each set of environmental conditions that influenced birth and death rates… …but have some general expectations of pattern: High rmax for organisms in *** habitats Low rmax for organisms in *** habitats
Rates of population growth are directly related to body size. • Population growth: • increases inversely with*** • Mean generation time: • Increases directly with ***
Assumptions of the model • 1. Population changes as proportion of current population size (∆ per capita) • ∆ x # individuals -->∆ in population; • 2. Constant rate of ∆; constant *** • 3. No resource limits • 4. All individuals are the same (*** )
Sample Exam ? Problem Set 2-1 (pg. 79) A moth species breeds in late summer and leaves only eggs to survive the winter. The adult dies after laying eggs. One local population of the moth increased from 5000 to 6000 in one year. Does this species have overlapping generations? Explain. What is for this population? Show calculations. Predict the population size after 3 yrs. Show calculations. What is one assumption you make in predicting the future population size?
Review: Problem Set 1 Geometric Growth ModelExponential Growth Model Select correct formula…
Objectives • Growth in unlimited environment • Geometric growth Nt+1 = Nt • Exponential growth Nt+1 = Ntert • dN/dt = rN • Model assumptions • Growth in limiting environment • Logistic growth dN/dt = rN (K - N)/ K • D-D birth and death rates • Model assumptions
Populations have the potential to increase rapidly…until balanced by extrinsic factors.
Population growth rate = Intrinsic Population Reduction in growth X size X growth rate rate at dueto crowding N close to 0
Assumptions of the exponential model • 1. No resource limits • 2. Population changes as proportion of current population size (∆ per capita) • ∆ x # individuals -->∆ in population; • 3. Constant rate of ∆; constant birth and death rates • 4. All individuals are the same (no age or size structure) 1,2,3 are violated ***
Population growth rates become *** aspopulation size increases. • Assumption of constant birth and death rates is violated. • Birth and/or death rates must change as pop. size changes.
Population equilibrium is reached when *** Those rates can change with density (=*** ).
Habitat quality affects reproductive variables affected (*** is lowered).
Population size is regulated by density-dependent factors affecting birth and/or death rates.
1) Density-dependence in plants first decreases growth.Size hierarchy develops. skewed
2) Density-dependence secondly increases some components of reproduction; decreases others…
3) Density-dependence thirdly decreases survival. Intraspecific competition causes “self-thinning”. Biomass (g) Density of surviving plants
r (intrinsic rate of increase) decreases as a *** . • Population growth is *** . rm slope = rm/K r r0 K N
Logistic equation • Describes a population that experiences *** density-dependence. • Population size stabilizes at K = *** • dN/dt = **** • where rm = maximum rate of increase w/o resource limitation = ‘intrinsic rate of increase’ *** = carrying capacity • *** = environmental break (resistance) = proportion of unused resources
Logistic (*** ) growth occurs when the population reaches a resource limit. • *** at K/2 separates accelerating and decelerating phases of population growth; point of ***
Logistic curve incorporates influences of *** per capita growth rate and*** population size. Specific
Assumptions of logistic model: • Population growth is proportional to the remaining resources (linear response) • All individuals can be represented by an average (no change in age structure) • Continuous resource renewal (constant E) • Instantaneous responses to crowding . *** • K and r are specific to particular organisms in a particular environment.
Review: Logistic Growth Model • Problem Set 2-3 (see pg. 80)