Download
1 / 46
460 likes | 642 Vues
Sociological classifications: The ‘GESDE’ services for classifications involving occupations, educational qualifications and ethnicity. Paul Lambert, University of Stirling Talk presented to the Census Programme Workshop on Spatial and Social Classifications, University of Leeds, 8 June 2010

E N D
Sociological classifications: The ‘GESDE’ services for classifications involving occupations, educational qualifications and ethnicity Paul Lambert, University of Stirling Talk presented to the Census Programme Workshop on Spatial and Social Classifications, University of Leeds, 8 June 2010 This work draws upon materials from the DAMES (www.dames.org.uk) project, an ESRC funded research Node working on ‘Data Management through e-Social Science’
Intro: Sociological classifications? GESDE? • Several ‘key variables’ in social science research are not just sociological, but are much debated there • Complex categorical measures and ‘variable operationalisation’ recommendations/debates • Individual level measures of social positioning… • ‘GESDE’ = 3 related online services which are “Grid Enabled Specialist Data Environments” • GEODE: the ‘o’ is for data on Occupations • GEEDE: the ‘e’ is for data on Educational qualifications • GEMDE: the ‘m’ is for data on ethnic Minorities
The ‘e-Social Science’ endeavoursee http://www.merc.ac.uk/ for up-to-date links • A number of UK projects seeking to improve social science research by capitalising on emerging computer science techniques • Handling distributed data; collaborative technologies; large and complex data; secure data • The ‘Grid’ embodies these technologies, but more generic terms like ‘e-Social Science’ & ‘Digital Social Science’ are increasingly preferred • GESDE: ‘Grid Enabled Specialist Data Environments’
Example: Understanding New Forms of Digital Records (DReSS) http://web.mac.com/andy.crabtree/NCeSS_Digital_Records_Node/DReSS.html • transcribed talk • audio • video • digital records • system logs • location video code tree transcript system log e-Social Science, BSA2009
Today’s talk from the ‘Data Management though e-Social Science’ node • DAMES – www.dames.org.uk • ESRC Node funded 2008-2011 • Aim: Useful social science provisions • Specialist data topics – occupations; education qualifications; ethnicity; social care; health • Mainstream packages and accessible resources • Resources from data support providers – e.g. ESDS, CESSDA • Academics’ own provisions – e.g. www.camsis.stir.ac.uk/occunits/distribution.html
To us ‘Data management’ means… • ‘the tasks associated with linking related data resources, with coding and re-coding data in a consistent manner, and with accessing related data resources and combining them within the process of analysis’[…DAMES Node..] • Usually performed by social scientists themselves • Pre-analysis tasks (though often revised/updated) • Inputs also from data providers • Usually a substantial component of the work process • But may not be explicitly rewarded (and sometimes penalised) • differentiate from archiving / controlling data itself
Some components… • Manipulating data • Recoding categories / ‘operationalising’ variables • Linking data • Linking related data (e.g. longitudinal studies) • combining / enhancing data (e.g. linking micro- and macro-data) • Secure access to data • Linking data with different levels of access permission • Detailed access to micro-data cf. access restrictions • Harmonisation standards • Approaches to linking ‘concepts’ and ‘measures’ (‘indicators’) • Recommendations on particular ‘variable constructions’ • Cleaning data • ‘missing values’; implausible responses; extreme values
Example –Linking data Linking via ‘ojbsoc00’ : c1-5 =original data / c6 = derived from data / c7 = derived from www.camsis.stir.ac.uk
..plus the centrality of keeping clear records of DM activities Reproducible (for self) Replicable (for all) Paper trail for whole lifecycle Cf. Dale 2006; Freese 2007 • In survey research, this means using clearly annotated syntax files (e.g. SPSS/Stata) Syntax Examples: www.dames.org.uk/workshops/ www.longitudinal.stir.ac.uk
Part 2: Variables on occupations, educational qualifications & ethnicity Well known challenges exploiting survey measures of each concept ..our response is usually too conservative.. Better ‘data management’ could/should allow us to get much more from data • Take account of more precisely measured differences • Scales/ranks from complex categorical measures • Longitudinal/cross-national comparisons • Complex multivariate models, interaction effects We have something to offer here: ‘GESDE’
GESDE: Grid Enabled Specialist Data Environments • Online facilities for collecting together, and distributing, specialist data resources • Occupations: GEODE project began 2005 • Education and Ethnicity: GEEDE and GEMDE began Feb. 2008 • Capacity building aims: improving use of measures of these concepts by • improving access to relevant information • providing training / advice on good practice
Data curation tool The curation tool obtains metadata and supports the storage and organisation of data resources in a more generic way
2(a) Data on occupations • Occupational unit groups = standardised lists of occupational titles • E.g. via CASCOT, www2.warwick.ac.uk/fac/soc/ier/publications/software/cascot/
..data on occupations.. • find ways of attaching summary information about occupations to occupational unit groups
Comparability problems => value of documenting methods & comparing alternatives
GEODE: Our contribution • GEODE acts as a library style service for access to ‘occupational information resources’ • We encourage people to supply data they’ve produced, and we upload data ourselves • Researchers are encouraged to use the portal to find and exploit suitable data • Services: search, browse, deposit data, link data, user ratings
Using occupational data: Example as a measure of marked social disadvantage Lambert & Gayle (2009) Survey Network 4 June 2009
All jobs, male scale: threshold=38.51Occupational unit groups with > 90 in BHPS sample Remember that these jobs’ scores are cross-classified by employment status
Can everyone be linked to occupations? (BHPS wave 17, excluding NI)
2(b) Data on educational qualifications • Similar issues arise with the use of educational data • Specialist resources exist which can enhance measures of educational data • Many users aren’t aware of alternative coding schemes or harmonised approaches • GEEDE acts as a service for bringing together and disseminating relevant data resources on educational measures
2(c) Data on ethnicity • We can conceive of similar information resources and data analysis requirements for measures of ethnicity • There are generally fewer published resources / agreed standards in this domain • GEMDE publishes resources but puts more emphasis on understanding complex ethnicity data
…why is working with ethnicity data in surveys so hard…? - It’s sparse - It’s collinear (e.g. to age, location) - It’s dynamic (cf. comparative research)
Data includes: • Generic & specialist studies collecting ethnic ‘referents’ ‘ethnic identity’; nationality, parents’ nationality; country of birth; language spoken; religion; ‘race’ : complex categorical data • National research: • Most countries have evolving standard definitions of ethnic groups, though not all surveys follow them • Some surveys cover large numbers from many/all groups • Most surveys only have sparse representation of most groups • Comparative research (international/longitudinal) : • Seen as highly problematic in many fields except immigration studies • Lambert, P.S. (2005). Ethnicity and the Comparative Analysis of Contemporary Survey Data. In J. H. P. Hoffmeyer-Zlotnick & J. Harkness (Eds.), Methodological Aspects in Cross-National Research (pp. 259-277). Manheim: ZUMA-Nachrichten Spezial 11.
UK EFFNATIS survey (1999) [Heckmann et al 2001]; [Penn & Lambert 2009]
A ‘data management’ contribution • Preserve information on what was done with categorical data • Communicate information on what should/could be done
Standardizing categorical data • ‘Measurement equivalence’ (e.g. van Deth, 2003) is often not feasible for complex categorical measures • For categorical data, equivalence for comparisons is often best approached in terms of meaning equivalence (because of non-linear relations between categories and shifting underlying distributions) (even if measurement equivalence seems possible) • Arithmetic standardisation offers a convenient form of meaning equivalence by indicating relative position with the structure defined by the current context • For categorical data, this can be achieved/approximated by scaling categories in one or more dimension of difference
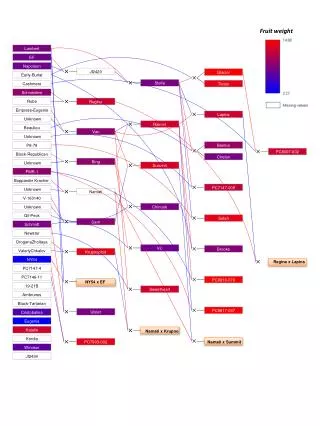
‘Effect proportional scaling’ using parents’ occupational advantage
What was that then? • We can represent categories through positions on a scale • In turn, we can use position in the dimension as a category score which then plugs into a further analysis (e.g. regression main and interaction effects) ..Some options for data on ethnicity.. • Stereotyped Ordered Logistic Regression (SOR) models, summarize dimensions of difference according to regression predictor values [e.g. Lambert and Penn, 2001] • Geometric data analysis for distances between people, or things [cf. Prandy, 1979; Bennett et al., 2009] • Assign category scores by hand (a priori or by selected average)
GEMDE seeks to promote replicability / transparency… • Document your own recodes • Access somebody else’s recodes • Identify commonly used recodes (& use them..!)
..and making complex analysis of ethnicity data easier.. • Organising complex categorical data • Labelling, recoding, etc • Effect proportional scaling • Standardisation • Interaction terms
The GEODE model for GEMDE? • ….A service for MUGs and MIRs… • Define/register ‘Minority Unit Groups’ • Define/register ‘Minority Information Resources’ • Explore data resources and obtain help in approaching analysis of complex, sparse data
What's a MIR? • 'Minority Information Resource'. • This is our own terminology. By a MIR, we mean any piece of information which supplies systematic data on a minority unit group (MUG) classification. We've used this term to be deliberately similar to the phrase 'Occupational Information Resources' that we used on GEODE • E.g. summary statistical data about the categories from and documentation or information • E.g. recodings which have been used in a particular study • Social scientists are not in general aware of the existence of MIRs (cf. wides use of popular Occupational Information Resources). In GEMDE we seek to publicise little know resources and promote their uptake: We argue that better communication and dissemination of MIRs is in fact an important step towards better scientific practice of replication and standardisation of research. • In our terms, every MIR necessarily links to a MUG (but not every MUG has a MIR).
The GEMDE prototype‘Liferay portal’ with access to MUGs and MIRs, first release Jan 2010 • Shibboleth access for registered users • Guest level access • Deposit MUGs/MIRs • Search/browse deposited resources • Feedback on resources (user ratings) • Review live data (e.g. pooled LFS records) • Expert and user quality ratings => …see the lab session...
Summary: Principles for supporting data on sociological classifications • Find specialist data information resources and preserve information on them • Promote easy-to-use means of coding these variables and incorporating them in multivariate analyses • Lab session: Examples of analysis using sociological classifications (using SPSS), and our prototype online services for finding information resources
Data used • Department for Education and Employment. (1997). Family and Working Lives Survey, 1994-1995 [computer file]. Colchester, Essex: UK Data Archive [distributor], SN: 3704. • Heckmann, F., Penn, R. D., & Schnapper, D. (Eds.). (2001). Effectiveness of National Integration Strategies Towards Second Generation Migrant Youth in a Comparative Perspective - EFFNATIS. Bamberg: European Forum for Migration Studies, University of Bamberg. • Inglehart, R. (2000). World Values Surveys and European Values Surveys 1981-4, 1990-3, 1995-7 [Computer file] (Vol. 2000). Ann Arbor, MI: Institute for Social Research [Producer]; Inter-university Consortium for Political and Social Research [Distributor]. • Li, Y., & Heath, A. F. (2008). Socio-Economic Position and Political Support of Black and Ethnic Minority Groups in the United Kingdom, 1972-2005 [computer file]. 2nd Edition. Colchester, Essex: UK Data Archive [distributor], SN: 5666. • Office for National Statistics. Social and Vital Statistics Division and Northern Ireland Statistics and Research Agency. Central Survey Unit, Quarterly Labour Force Survey, January - March, 2008 [computer file]. 4th Edition. Colchester, Essex: UK Data Archive [distributor], March 2010. SN: 5851. • University of Essex, & Institute for Social and Economic Research. (2009). British Household Panel Survey: Waves 1-17, 1991-2008 [computer file], 5th Edition. Colchester, Essex: UK Data Archive [distributor], March 2009, SN 5151.
References • Bennett, T., Savage, M., Silva, E. B., Warde, A., Gayo-Cal, M., Wright, D., et al. (2009). Culture, Class, Distinction. London: Routledge. • Dale, A. (2006). Quality Issues with Survey Research. International Journal of Social Research Methodology, 9(2), 143-158. • Freese, J. (2007). Replication Standards for Quantitative Social Science: Why Not Sociology? Sociological Methods and Research, 36(2), 153-171. • Lambert, P. S., & Gayle, V. (2009). 'Escape from Poverty' and Occupations. Colchester, Essex and www.iser.essex.ac.uk/events/conferences/bhps-2009-conference/overview Paper presented to the BHPS Research Conference, 9-11 July 2009 • Lambert, P. S., & Penn, R. D. (2001). SOR models and Ethnicity data in LIS and LES : Country by Country Report. Syracuse University, Syracuse, New York 13244-1020: Luxembourg Income Study Paper No. 260, Maxwell School of Citizenship and Public Affairs. • Penn, R. D., & Lambert, P. S. (2009). Children of International Migrants in Europe: Comparative Perspectives. Basingstoke: Palgrave. • Prandy, K. (1979). Ethnic discrimination in employment and housing. Ethnic and Racial Studies, 2(1), 66-79. • Simpson, L., & Akinwale, B. (2006). Quantifying Stablity and Change in Ethnic Group. Manchester: University of Manchester, CCSR Working Paper 2006-05. • van Deth, J. W. (2003). Using Published Survey Data. In J. A. Harkness, F. J. R. van de Vijver & P. P. Mohler (Eds.), Cross-Cultural Survey Methods (pp. 329-346). New York: Wiley.