PJM as Part of the Eastern Interconnection
150 likes | 408 Vues
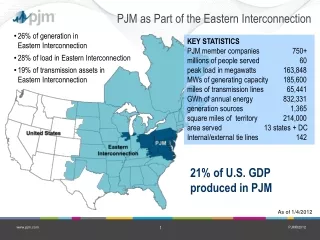
PJM as Part of the Eastern Interconnection. 26% of generation in Eastern Interconnection 28% of load in Eastern Interconnection 19% of transmission assets in Eastern Interconnection. KEY STATISTICS

PJM as Part of the Eastern Interconnection
E N D
Presentation Transcript
PJM as Part of the Eastern Interconnection • 26% of generation in Eastern Interconnection • 28% of load in Eastern Interconnection • 19% of transmission assets in Eastern Interconnection KEY STATISTICS PJM member companies 750+millions of people served 60 peak load in megawatts 163,848MWs of generating capacity 185,600miles of transmission lines 65,441GWh of annual energy 832,331generation sources 1,365square miles of territory 214,000area served 13 states + DCInternal/external tie lines 142 21% of U.S. GDP produced in PJM As of 1/4/2012
Reliability • Resource Adequacy: • System capacity • Transmission Security: • Energy & services where needed • Managing retrofit outages • Location, Location, Location: • Transmission related issues • Encourage resources where needed • Regulation, black start, congestion management
At-Risk Generation Nearly 25 GW coal generation at risk based on economic analysis Note: CONE is the Cost of New Entry (Simple Cycle Combustion Turbine) Source: PJM Report, Coal Capacity At-Risk for Retirement in PJM: Potential Impacts of the Finalized EPA Cross State Air Pollution Rule and Proposed National Emissions Standards for Hazardous Air Pollutants, August 2011
Generation Resource Retirements Over 16,400 MW of Pending Deactivations (~13,800 MW since 11/2011)
Environmental Retrofit Outagesand Typical Maintenance Outages *Some retrofit outages may be included in typical maintenance outages.