Download
1 / 23
230 likes | 422 Vues
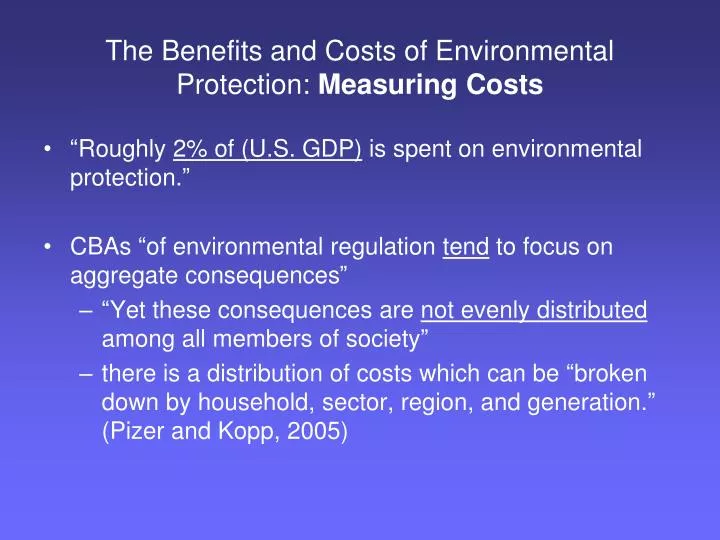
The Benefits and Costs of Environmental Protection: Measuring Costs. “Roughly 2% of (U.S. GDP) is spent on environmental protection.” CBAs “of environmental regulation tend to focus on aggregate consequences”

E N D
The Benefits and Costs of Environmental Protection: Measuring Costs • “Roughly 2% of (U.S. GDP) is spent on environmental protection.” • CBAs “of environmental regulation tend to focus on aggregate consequences” • “Yet these consequences are not evenly distributed among all members of society” • there is a distribution of costs which can be “broken down by household, sector, region, and generation.” (Pizer and Kopp, 2005)
Conceptualization of cost for environmental policy: (Revesz and Stavins, 2007, 511) • “(T)he value of whatever must be sacrificed to prevent (or reduce the risk of) an environmental impact. • (T)he forgone social benefits due to employing scarce resources for environmental policy purposes, instead of putting those resources to their next best use.”
The Benefits and Costs of Environmental Protection: Measuring Costs • The true economic costs of environmental protection are the opportunity costs • (Social) opportunity costs: the highest-value alternative use to which inputs (resources) might have been put and that society has to forego when the inputs are used. • What you give up by taking one action and not another • What’s the cost of attending UCD? • “Sticker” price? The opportunity cost? • NB of the best alternative opportunity foregone
Do environmental regulations cost jobs? • Greenstone (2002): “The Impacts of Environmental Regulations on Industrial Activity: Evidence from the 1970 and 1977 Clean Air Act Amendments and the Census of Manufactures” • “…first 15 years after the Amendments became law (1972- 1987): • nonattainment counties (relative to attainment ones) lost approximately • 590,000 jobs, • $37B in capital stock, and • $75B (1987$) of output in pollution intensive industries”. • “…undermine(s) the contention that environmental regulations are costless or even beneficial for the regulated.”
Taxonomy of costs • From most obvious to most comprehensive: Abatement (the reduction of a “bad”, typically pollution) Compliance Partial equil’m/behavioral response General equilibrium/Secondary effects • What if a regulated firm chooses to close a plant under a new regulation? Under what notion of costs would that be captured?
Example: costs of policy to ban CFCs • Response: develop CFC replacements like freon. • Possible costs • Replacement: Increased costs of production for the replacement • R&D: The diverted resources necessary to develop the substitute • Obsolescence: The value of services of specialized capital and technology • Consumer welfare: Change retail price of replacement (lost surplus) Kopp et al. 1997
Example: costs of policy to ban CFCs • Abatement expenditures: out-of-pocket costs for abatement equipment (used to reduce pollution) • Most popular (but poor) concept of regulatory cost in the analysis of environmental programs • Compliance cost:the cost of all policy compliance actions (captures costs outside of abatement, e.g. process change).
Direct costs: Abatement • Abatement expenditures: out-of-pocket costs for abatement equipment (used to reduce pollution) • Most popular (but poor) concept of regulatory cost in the analysis of environmental programs Wood Products MACTPictured above is a Regenerative Catalytic Oxidizer designed to meet the EPA's MACT for plywood, particleboard, veneer, OSB, MDF and specialty wood products plants. www.aircleantech.com
Direct costs: Compliance costs • CC:the cost of all policy compliance actions • Better than simply focusing on abatement cost… • Captures costs outside of abatement (e.g. process change) • CC: may be sufficient when “behavioral response, transitional costs and indirect costs are small” (Revesz and Stavins, 2007, 512).
Partial vs. general equilibrium • Partial equilibrium costs • the burden directly borne by the regulated entity (firms, households, government) • when prices are held constant. • General equilibrium costs • the net burden once all good and factor markets have equilibrated. (Pizer and Kopp, 2005)
Accounting for behavioral response When we account for behavioral responses in the regulated sector (but no further) we are conducting a “partial equilibrium analysis” (vs. a multi-sector general equilibrium). Story: new regulation increases the MC of paper production from MC1to MC2 • What are the implications for consumer surplus given a flat demand curve? • What is the area D+E? Is this a reasonable measure of the cost of the regulation? • What is the increase in total cost of producing r1 (the initial quantity) after the regulation? Why might it be misleading to use this as an estimate of compliance cost? • What are the social costs of the regulation? (Note: we’re not looking at the benefit side of the policy now, just costs.) $ MC2 MC1 F Demand A D B E C output r2 r1
“General equilibrium” or“secondary” effects • Secondary effects: (economic) outcomes of a policy that extend beyond the primary market being regulated • When are secondary effects likely important? • For regulations that affect highly integrated sectors of the economy • Produce widely used intermediate products • E.g. energy • Regulations that generate large direct costs • If costs are passed to consumers their overall consumption might fall • Industry may contract (employees reduced) • Compliance consulting industry might grow Material from RFF B-C primer
Example: (1) Clean Water Act, and (2) Clean Air Act. Hazilla and Kopp, 1990. “Social Cost of Environmental Quality Regulations: A General Equilibrium Analysis” • Effects in table are just the compliance costs.
The secondary effect analysis (SEA)(CAA/CWA e.g. continued) • SEA: A large mathematical model of consumers and producers in many industries • Parameters of the model (e.g. how do consumers value consumption versus leisure?) are estimated from historical data • Model is “run” twice • Without the proposed policy (“baseline”, “counterfactual”) • With the proposed policy • What kinds of behavioral links does it capture? • Individual household choices: • Regulation increases prices • Price of consumption (versus leisure) goes up • People work less (labor supply falls), savings rate falls (capital supply falls) • Individual (and therefore aggregate) economic growth is reduced • Analogous story for firm decisions
Secondary effect analysis results (e.g. continued) • Compliance investments: required in 13 sectors • BUT, production costs increased and output and labor productivity fell in all sectors. • E.g. finance sector: bore no compliance cost, BUT cost of production is 2% higher (higher input costs)
Conclusions of the study • In other words, regulation causes prices to rise but then consumers adapt, substituting towards other goods. Ignoring consumer response leads to a overstatement of costs of the CAA & CWA and therefore an understatement of net benefits. Hazilla and Kopp, 1990. “Social Cost of Environmental Quality Regulations: A General Equilibrium Analysis”. Journal of Political Economy, vol. 98, no. 4 (August), pp. 853-873.
Overall record of cost estimation • Harrington et al. (2000): examined 28 environmental and occupational safety regulations • Half the cases: cost estimates > actual costs • Per-unit abatement costs: over- and under-estimation error equally common • BUT: When economic incentives instruments used, per-unit costs were consistently overestimated. • Attributed to technological innovation stimulated by market-based instruments. (via Revesz and Stavins, 2007, 513)
Policy cost example: “Distributional and Efficiency Impacts ofIncreased US Gasoline Taxes”Bento et al. (2009) • What happens when we impose a $0.25 tax on gasoline? • Econometrically based multimarket simulation model. • Behavioral response: • fuel consumption, • vehicle miles traveled (VMT) • fleet composition (new and used)
Bento et al. (2009) • Distribution across 20,000 households • Varying: income, region of residence, race, and employment status • Random sample, National Household Travel Survey • Utility maximization framework • theoretically sound welfare indexes of distributional impacts
Bento et al. (2009) • Revenue recycling scenarios—distribute gas tax revenue by: • “Flat”: equal amounts to every household. • “Income-based”: according to income share • “VMT-based”: according to VMT share (baseline) • Results: 25 cent tax welfare loss of $30/yr (2001$, avg per household) • Cost-side only, excludes external benefits
Welfare impacts by race & income For lowest income bracket: refund > taxes paid EV: “equivalent variation” welfare measure based on compensated demand. WTP to avoid the price increase before it occurs.
Decomposition of welfare impacts “progressive” “regressive” slightly progressive for lowest bracket but mostly even
Other cost issues • Dynamic: technological progress • Enforcement: gov. admin., monitoring and enforcement • Environmental costs: e.g. S02 sludge from scrubbers (risk-risk) • “Negative costs”: increases in productivity from cleaner environment, process improvements from innovation spurred by regulation.