Tuning Baryon and Strange Particle Production with PYTHIA at the LHC
This presentation by Rick Field from the University of Florida discusses fragmentation tuning and the underlying event in particle collisions at the LHC. It covers the various PYTHIA tunes, including AMBT1 and Z1, comparing CMS and ATLAS data at 900 GeV and 7 TeV. The talk elaborates on high transverse momentum jets and the significance of the underlying event as a background in collider measurements. By analyzing charged particle correlations and employing Monte Carlo models, the study aims to enhance the accuracy of collider observables through better understanding of QCD processes.

Tuning Baryon and Strange Particle Production with PYTHIA at the LHC
E N D
Presentation Transcript
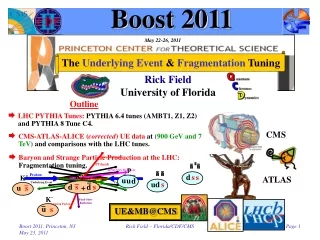
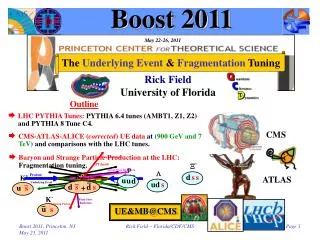
Boost 2011 May 22-26, 2011 The Underlying Event & Fragmentation Tuning Rick Field University of Florida Outline • LHC PYTHIA Tunes:PYTHIA 6.4 tunes (AMBT1, Z1, Z2) and PYTHIA 8 Tune C4. CMS • CMS-ATLAS-ALICE (corrected) UE dataat (900 GeV and 7 TeV) and comparisons with the LHC tunes. • Baryon and Strange Particle Production at the LHC: Fragmentation tuning. ATLAS UE&MB@CMS Rick Field – Florida/CDF/CMS
“Hard Scattering” Component QCD Monte-Carlo Models:High Transverse Momentum Jets • Start with the perturbative 2-to-2 (or sometimes 2-to-3) parton-parton scattering and add initial and final-state gluon radiation (in the leading log approximation or modified leading log approximation). “Underlying Event” • The “underlying event” consists of the “beam-beam remnants” and from particles arising from soft or semi-soft multiple parton interactions (MPI). The “underlying event” is an unavoidable background to most collider observables and having good understand of it leads to more precise collider measurements! • Of course the outgoing colored partons fragment into hadron “jet” and inevitably “underlying event” observables receive contributions from initial and final-state radiation. Rick Field – Florida/CDF/CMS
Traditional Approach CDF Run 1 Analysis • Look at charged particle correlations in the azimuthal angle Df relative to a leading object (i.e. CaloJet#1, ChgJet#1, PTmax, Z-boson). For CDF PTmin = 0.5 GeV/c hcut = 1. Charged Particle Df Correlations PT > PTmin |h| < hcut Leading Calorimeter Jet or Leading Charged Particle Jet or Leading Charged Particle or Z-Boson “Transverse” region very sensitive to the “underlying event”! • Define |Df| < 60o as “Toward”, 60o < |Df| < 120o as “Transverse”, and |Df| > 120o as “Away”. • All three regions have the same area in h-f space, Dh×Df = 2hcut×120o = 2hcut×2p/3. Construct densities by dividing by the area in h-f space. Rick Field – Florida/CDF/CMS
ATLAS Tune AMBT1 Judith Katzy LPCC MB&UE working group meeting, May 31, 2010. Emily Nurse ICHEP, July 24, 2010. ATLAS-CONF-2010-031 Rick Field – Florida/CDF/CMS
ATLAS Tune AMBT1 Subset of the “min-bias” data! • Attempt to fit a subset of the “min-bias” data (Nchg ≥ 6) where the contamination due to diffraction is expected to be small! Rick Field – Florida/CDF/CMS
PYTHIA Tune Z1 • All my previous tunes (A, DW, DWT, D6, D6T, CW, X1, and X2) were PYTHIA 6.4 tunes using the old Q2-ordered parton showers and the old MPI model (really 6.2 tunes)! PARP(90) PARP(82) Color • I believe that it is time to move to PYTHIA 6.4 (pT-ordered parton showers and new MPI model)! Connections Diffraction • Tune Z1: I started with the parameters of ATLAS Tune AMBT1, but I changed LO* to CTEQ5L and I varied PARP(82) and PARP(90) to get a very good fit of the CMS UE data at 900 GeV and 7 TeV. • The ATLAS Tune AMBT1 was designed to fit the inelastic data for Nchg ≥ 6 and to fit the PTmax UE data with PTmax > 10 GeV/c. Tune AMBT1 is primarily a min-bias tune, while Tune Z1 is a UE tune! UE&MB@CMS Rick Field – Florida/CDF/CMS
PYTHIA Tune Z1 Parameters not shown are the PYTHIA 6.4 defaults! Rick Field – Florida/CDF/CMS
CMS UE Data CMS CMS Tune Z1 • CMS preliminary data at 900 GeV and 7 TeV on the “transverse” charged particle density, dN/dhdf, as defined by the leading charged particle jet (chgjet#1) for charged particles with pT > 0.5 GeV/c and |h| < 2.0. The data are uncorrected and compared with PYTHIA Tune DW and D6T after detector simulation (SIM). • CMS preliminary data at 900 GeV and 7 TeV on the “transverse” charged particle density, dN/dhdf, as defined by the leading charged particle jet (chgjet#1) for charged particles with pT > 0.5 GeV/c and |h| < 2.0. The data are uncorrected and compared with PYTHIA Tune Z1 after detector simulation (SIM). Tune Z1 (CTEQ5L) PARP(82) = 1.932 PARP(90) = 0.275 PARP(77) = 1.016 PARP(78) = 0.538 Color reconnection suppression. Color reconnection strength. Tune Z1 is a PYTHIA 6.4 using pT-ordered parton showers and the new MPI model! Rick Field – Florida/CDF/CMS
PYTHIA 6.2 Tunes UE Parameters Uses CTEQ6L Reduce PARP(82) by factor of 1.8/1.9 = 0.95 Everything else the same! ISR Parameter Tune A energy dependence! (not the default) Intrinsic KT CMS: We wanted a CTEQ6L version of Tune Z1 in a hurry! Rick Field – Florida/CDF/CMS
PYTHIA Tune Z2 My guess! Reduce PARP(82) by factor of 1.83/1.93 = 0.95 Everything else the same! Rick Field – Florida/CDF/CMS
PYTHIA Tune Z2 My guess! Reduce PARP(82) by factor of 1.83/1.93 = 0.95 Everything else the same! PARP(90) same For Z1 and Z2! Rick Field – Florida/CDF/CMS
PYTHIA 8 Tunes R. Corke and T. Sjöstrand CTEQ6L MRST LO** CTEQ6L PT0 = PARP(82) e = PARP(90) Tevatron LHC pT0(W)=pT0(W/W0)e e = PARP(90) pT0 = PARP(82) W = Ecm Rick Field – Florida/CDF/CMS
PYTHIA Tune Z2 PARP(90) much different! Rick Field – Florida/CDF/CMS
CMS UE Data New CMS CMS Tune Z1 Tune Z1 • CMS preliminary data at 900 GeV and 7 TeV on the “transverse” charged PTsum density, dPT/dhdf, as defined by the leading charged particle jet (chgjet#1) for charged particles with pT > 0.5 GeV/c and |h| < 2.0. The data are corrected and compared with PYTHIA Tune Z1 at the generator level. • CMS preliminary data at 900 GeV and 7 TeV on the “transverse” charged particle density, dN/dhdf, as defined by the leading charged particle jet (chgjet#1) for charged particles with pT > 0.5 GeV/c and |h| < 2.0. The data are corrected and compared with PYTHIA Tune Z1 at the generator level. CMS corrected data! CMS corrected data! Very nice agreement! Rick Field – Florida/CDF/CMS
PYTHIA 6.4 Tune Z2 Tune Z2 Tune Z2 • CMS preliminary data at 900 GeV and 7 TeV on the “transverse” charged PTsum density, dPT/dhdf, as defined by the leading charged particle jet (chgjet#1) for charged particles with pT > 0.5 GeV/c and |h| < 2.0. The data are corrected and compared with PYTHIA Tune Z2 at the generator level. • CMS preliminary data at 900 GeV and 7 TeV on the “transverse” charged particle density, dN/dhdf, as defined by the leading charged particle jet (chgjet#1) for charged particles with pT > 0.5 GeV/c and |h| < 2.0. The data are corrected and compared with PYTHIA Tune Z2 at the generator level. CMS corrected data! CMS corrected data! Not good! Bad energy dependence! Rick Field – Florida/CDF/CMS
PYTHIA 8 Tune C4 PY8 Tune C4 PY8 Tune C4 • CMS preliminary data at 900 GeV and 7 TeV on the “transverse” charged PTsum density, dPT/dhdf, as defined by the leading charged particle jet (chgjet#1) for charged particles with pT > 0.5 GeV/c and |h| < 2.0. The data are corrected and compared with PYTHIA 8 Tune C4 at the generator level. • CMS preliminary data at 900 GeV and 7 TeV on the “transverse” charged particle density, dN/dhdf, as defined by the leading charged particle jet (chgjet#1) for charged particles with pT > 0.5 GeV/c and |h| < 2.0. The data are corrected and compared with PYTHIA 8 Tune C4 at the generator level. CMS corrected data! CMS corrected data! Not good! PTsum too small! Rick Field – Florida/CDF/CMS
Transverse Ratio: PTsum/Nchg Tune Z2 Tune Z1 • CMS preliminary data at 900 GeV and 7 TeV on the “transverse” ratio PTsum/Nchg as defined by the leading charged particle jet (chgjet#1) for charged particles with pT > 0.5 GeV/c and |h| < 2.0 compared with PYTHIA Tune Z1, Z2, and PY8C4 at the generator level. PY8 Tune C4 Z1 good! PY8C4 and Z2 Bad! Rick Field – Florida/CDF/CMS
Energy Dependence CTEQ6L: PARP(90) = 0.19 CTEQ5L: PARP(90) =0.275 CTEQ6L: PARP(90) =0.275 • CMS data on the energy dependence (7 TeV divided by 900 GeV) of the “transverse” charged PTsum density as defined by the leading charged particle jet (chgjet#1) for charged particles with pT > 0.5 GeV/c and |h| < 2.0 compared with PYTHIA Tune Z1, Z2, and PY8C4 at the generator level. • CMS data on the energy dependence (7 TeV divided by 900 GeV) of the “transverse” charged particle density as defined by the leading charged particle jet (chgjet#1) for charged particles with pT > 0.5 GeV/c and |h| < 2.0 compared with PYTHIA Tune Z1, Z2, and PY8C4 at the generator level. CMS corrected data! CMS corrected data! Duh! The energy dependence depends on both PARP(90) and the structure function! Z1 and PY8C4 good! Z2 Bad! Rick Field – Florida/CDF/CMS
PYTHIA Tune Z2* CMS GEN Group: Working on an improved Z2 tune (Tune Z2*) using the Professor (A. Knutsson & M. Zakaria). Rick Field – Florida/CDF/CMS
ATLAS UE Data ATLAS ATLAS Tune Z1 Tune Z1 • ATLAS published data at 900 GeV and 7 TeV on the “transverse” charged particle density, dN/dhdf, as defined by the leading charged particle (PTmax) for charged particles with pT > 0.5 GeV/c and |h| < 2.5. The data are corrected and compared with PYTHIA Tune Z1 at the generator level. • ATLAS published data at 900 GeV and 7 TeV on the “transverse” charged PTsum density, dPT/dhdf, as defined by the leading charged particle (PTmax) for charged particles with pT > 0.5 GeV/c and |h| < 2.5. The data are corrected and compared with PYTHIA Tune Z1 at the generrator level. ATLAS publication – arXiv:1012.0791 December 3, 2010 Rick Field – Florida/CDF/CMS
CMS-ATLAS UE Data CMS: Chgjet#1 Tune Z1 Tune Z1 ATLAS: PTmax • CMS preliminary data at 7 TeV on the “transverse” charged particle density, dN/dhdf, as defined by the leading charged particle jet (chgjet#1) for charged particles with pT > 0.5 GeV/c and |h| < 2.0 together with the ATLAS published data at 7 TeV on the “transverse” charged particle density, dN/dhdf, as defined by the leading charged particle (PTmax) for charged particles with pT > 0.5 GeV/c and |h| < 2.5 The data are corrected and compared with PYTHIA Tune Z1 at the generator level. Amazing agreement! Rick Field – Florida/CDF/CMS
ATLAS UE Data Tune Z1 Tune Z1 ATLAS ATLAS • ATLAS published data at 7 TeV on the “transverse” charged particle density, dN/dhdf, as defined by the leading charged particle (PTmax) for charged particles with pT > 0.5 GeV/c and pT > 0.1 GeV/c (|h| < 2.5). The data are corrected and compared with PYTHIA Tune Z1 at the generator level. • ATLAS published data at 7 TeV on the “transverse” charged PTsum density, dPT/dhdf, as defined by the leading charged particle (PTmax) for charged particles with pT > 0.5 GeV/c and pT > 0.1 GeV/c (|h| < 2.5). The data are corrected and compared with PYTHIA Tune Z1 at the generator level. ATLAS publication – arXiv:1012.0791 December 3, 2010 Rick Field – Florida/CDF/CMS
ALICE UE Data ALICE ALICE Tune Z1 Tune Z1 • ALICE preliminary data at 900 GeV and 7 TeV on the “transverse” charged particle density, dN/dhdf, as defined by the leading charged particle (PTmax) for charged particles with pT > 0.5 GeV/c and |h| < 0.8. The data are corrected and compared with PYTHIA Tune Z1 at the generator level. • ALICE preliminary data at 900 GeV and 7 TeV on the “transverse” charged PTsum density, dPT/dhdf, as defined by the leading charged particle (PTmax) for charged particles with pT > 0.5 GeV/c and |h| < 0.8. The data are corrected and compared with PYTHIA Tune Z1 at the generrator level. ALICE UE Data: Talk by S. Vallero MPI@LHC 2010 Glasgow, Scotland November 30, 2010 I read the points off with a ruler! Rick Field – Florida/CDF/CMS
PYTHIA Tune Z1 Oops Tune Z1 is slightly high at CDF! Tune Z1 CMS CDF Tune Z1 • CMS preliminary data at 900 GeV and 7 TeV on the “transverse” charged particle density, dN/dhdf, as defined by the leading charged particle jet (chgjet#1) for charged particles with pT > 0.5 GeV/c and |h| < 2. The data are uncorrected and compared with PYTHIA Tune Z1 after detector simulation. • CDF published data at 1.96 TeV on the “transverse” charged particle density, dN/dhdf, as defined by the leading calorimeter jet (jet#1) for charged particles with pT > 0.5 GeV/c and |h| < 1.0. The data are corrected and compared with PYTHIA Tune Z1 at the generator level. Rick Field – Florida/CDF/CMS
UE Summary & Conclusions I still dream of a “universal” tune that fits the UE at all energies! Need to simultaneously tune LHC plus CDF (“professor” tune)! • We now have lots of corrected UE data from the LHC! Tune Z1 (CTEQ5L) does nice job of fitting the CMS, ATLAS, and ALICE UE data at 900 GeV and 7 TeV! But Tune Z1 is a little high at CDF (1.96 TeV)! • CTEQ6L Tune: PYTHIA 6.4 Tune Z2 and PYTHIA 8 Tune C4 both use CTEQ6L, but do not fit the LHC UE data as well as Tune Z1. • Next Step: More PYTHIA 6.4 and PYTHIA 8 tunes. Time to look more closely at Sherpa and HERWIG++! CMS GEN Group: Working on an improved Z2 tune (Tune Z2*) and an improved PY8C4 tune (Tune C4*) using the Professor (A. Knutsson & M. Zakaria). Sorry not enough time to show all the LHC tunes! • ATLAS Tuning Effort (A. Buckley, J. Katzy et al.): AMBT1, AUET1 (Herwig+Jimmy). Coming soon AUET2 (Herwig + Jimmy), AMBT2! Four stage approach: Flavor, FS fragmentation, ISR, MPI. Rick Field – Florida/CDF/CMS
Min-Bias Collisions ALICE INEL = NSD + SD NSD = ND + DD CMS Tune Z1 Tune Z1 • CMS NSD data on the charged particle rapidity distribution at 7 TeV compared with PYTHIA Tune Z1. The plot shows the average number of particles per NSD collision per unit h, (1/NNSD) dN/dh. • ALICE NSD data on the charged particle rapidity distribution at 900 GeV compared with PYTHIA Tune Z1. The plot shows the average number of particles per INEL collision per unit h, (1/NINEL) dN/dh. Okay not perfect, but remember we know that SD and DD are not modeled well! Rick Field – Florida/CDF/CMS
Baryon & Strange Particle Production at the LHC • Strange Particle Production in Proton-Proton Collisions at 900 GeV with ALICE at the LHC, arXiv:1012.3257 [hep-ex] December 18, 2010. INEL • Production of Pions, Kaons and Protons in pp Collisions at 900 GeV with ALICE at the LHC, arXiv:1101.4110 [hep-ex] January 25, 2011. INEL • Strange Particle Production in pp Collisions at 900 GeV and 7 TeV, CMS Paper: arXiv:1102.4282 [hep-ex] Feb 21, 2011, submitted to JHEP. NSD I know there are more nice results from the LHC, but this is all I can show today. Sorry! Step 1:Look at the overall particle yields (all pT). Step 2:Look at the ratios of the overall particle yields (all pT). Step 3:Look at the pT dependence of the particle yields and ratios. Rick Field – Florida/CDF/CMS
Kaon Production • CMS NSD data on the Kshort rapidity distribution at 7 TeV and 900 GeV compared with PYTHIA Tune Z1. The plot shows the average number of Kshort per NSD collision per unit Y, (1/NNSD) dN/dY. CMS INEL = NSD + SD Tune Z1 Tune Z1 • CMS NSD data on the Kshort rapidity distribution at 900 GeV and the ALICE point at Y = 0 (INEL) compared with PYTHIA Tune Z1. The ALICE point is the average number of Kshort per INEL collision per unit Y at Y = 0, (1/NINEL) dN/dY. No overall shortage of Kaons in PYTHIA Tune Z1! Rick Field – Florida/CDF/CMS
Kaon Production • ALICE INEL data on the charged kaon rapidity distribution at 900 GeV compared with PYTHIA Tune Z1. The plot shows the average number of charged kaons per INEL collision per unit Y at Y = 0, (1/NINEL) dN/dY. ALICE ALICE Tune Z1 Tune Z1 • ALICE INEL data on the charged kaon to charged pion rapidity ratio at 900 GeV compared with PYTHIA Tune Z1. No overall shortage of Kaons in PYTHIA Tune Z1! Rick Field – Florida/CDF/CMS
Kaon Production CMS measures (1/NNSD) dN/dY • Rick’s plot of the CMS NSD data on the Kshort rapidity distribution at 7 TeV and 900 GeV. The plot shows the average number of Kshort per NSD collision per unit Y, (1/NNSD) dN/dY, versus Y from -2 → 2. I have plotted the same data twice! This is the correct way! versus |Y| from 0 → 2 • Real CMS NSD data on the Kshort rapidity distribution at 7 TeV and 900 GeV. The plot shows the average number of Kshort per NSD collision per unit Y, (1/NNSD) dN/dY, versus |Y| from 0 → 2. Warning: I am not plotting what CMS actually measures! I am old and I like to see both sides so I assumed symmetry about Y = 0 and plotted the same data on both sides (Y → -Y). The way CMS does it is the correct way! But my way helps me see better what is going on. Please refer to the CMS publication for the official plots! Rick Field – Florida/CDF/CMS
Lambda Production • CMS NSD data on the Lambda+AntiLambda rapidity distribution at 7 TeV and 900 GeV compared with PYTHIA Tune Z1. The plot shows the average number of particles per NSD collision per unit Y, (1/NNSD) dN/dY. CMS Factor of 1.5! CMS Tune Z1 Tune Z1 • CMS NSD data on the Lambda+AntiLambda to 2Kshort rapidity ratio at 7 TeV compared with PYTHIA Tune Z1. Oops! Not enough Lambda’s in PYTHIA Tune Z1! Rick Field – Florida/CDF/CMS
Cascade Production • CMS NSD data on the Cascade-+AntiCascade- rapidity distribution at 7 TeV and 900 GeV compared with PYTHIA Tune Z1. The plot shows the average number of particles per NSD collision per unit Y, (1/NNSD) dN/dY. CMS CMS Factor of 2! Tune Z1 Tune Z1 • CMS data on the Cascade-+AntiCascade- to 2Kshort rapidity ratio at 7 TeV compared with PYTHIA Tune Z1. Yikes! Way too few Cascade’s in PYTHIA Tune Z1! Rick Field – Florida/CDF/CMS
PYTHIA Fragmentation Parameters • PARJ(1) : (D = 0.10) is P(qq)/P(q), the suppression of diquark-antidiquark pair production in the colour field, compared with quark–antiquark production. Notation: PARJ(1) = qq/q Can we increase the overall rate of strange baryons without messing up anything else? • PARJ(2) : (D = 0.30) is P(s)/P(u), the suppression of s quark pair production in the field compared with u or d pair production. Notation: PARJ(2) = s/u. • PARJ(3) : (D = 0.4) is (P(us)/P(ud))/(P(s)/P(u)), the extra suppression of strange diquark production compared with the normal suppression of strange quarks. Notation: PARJ(3) = us/u . Rick Field – Florida/CDF/CMS
PYTHIA Fragmentation Parameters • PYTHIA Tune Z1C: Same as Tune Z1 except qq/q is increased 0.1 → 0.12 and us/s is increased from 0.4 → 0.8. Rick Field – Florida/CDF/CMS
Kaon Production • CMS NSD data on the Kshort rapidity distribution at 7 TeV and 900 GeV compared with PYTHIA Tune Z1. The plot shows the average number of Kshort per NSD collision per unit Y, (1/NNSD) dN/dY. CMS CMS Tune Z1C Tune Z1 • CMS dNSD ata on the Kshort rapidity distribution at 7 TeV and 900 GeV compared with PYTHIA Tune Z1C. The plot shows the average number of Kshort per NSD collision per unit Y, (1/NNSD) dN/dY. For Kaon production Tune Z1 and Z1C are almost identical! Rick Field – Florida/CDF/CMS
Lambda Production • CMS NSD data on the Lambda+AntiLambda rapidity distribution at 7 TeV and 900 GeV compared with PYTHIA Tune Z1. The plot shows the average number of particles per NSD collision per unit Y, (1/NNSD) dN/dY. CMS Tune Z1C CMS Tune Z1 • CMS NSD data on the Lambda+AntiLambda rapidity distribution at 7 TeV and 900 GeV compared with PYTHIA Tune Z1. The plot shows the average number of particles per NSD collision per unit Y, (1/NNSD) dN/dY. Not bad! Many more Lambda’s in PYTHIA Tune Z1C! Rick Field – Florida/CDF/CMS
Cascade Production • CMS NSD data on the Cascade-+AntiCascade- rapidity distribution at 7 TeV and 900 GeV compared with PYTHIA Tune Z1. The plot shows the average number of particles per NSD collision per unit Y, (1/NNSD) dN/dY. CMS CMS Tune Z1C Tune Z1 • CMS NSD data on the Cascade-+AntiCascade- rapidity distribution at 7 TeV and 900 GeV compared with PYTHIA Tune Z1. The plot shows the average number of particles per NSD collision per unit Y, (1/NNSD) dN/dY. Wow! PYTHIA Tune Z1C looks very nice here! Rick Field – Florida/CDF/CMS
Transverse Momentum Distributions • CMS NSD data on the Kshort transverse momentum distribution at 7 TeV compared with PYTHIA Tune Z1 & Z1C. The plot shows the average number of particles per NSD collision per unit pT, (1/NNSD) dN/dpT for |Y| < 2. • CMS NSD data on the Lambda+AntiLambda transverse momentum distribution at 7 TeV compared with PYTHIA Tune Z1 & Z1C. The plot shows the average number of particles per NSD collision per unit pT, (1/NNSD) dN/dpT for |Y| < 2. PYTHIA Tune Z1 & Z1C are a bit off on the pT dependence! Rick Field – Florida/CDF/CMS
Transverse Momentum Distributions • CMS NSD data on the Cascade-+AntiCascade- transverse momentum distribution at 7 TeV compared with PYTHIA Tune Z1 & Z1C. The plot shows the average number of particles per NSD collision per unit pT, (1/NNSD) dN/dpT for |Y| < 2. • CMS NSD data on the Cascade-+AntiCascade- transverse momentum distribution at 7 TeV (normalized to 1) compared with PYTHIA Tune Z1 & Z1C. PYTHIA Tune Z1 & Z1C are a bit off on the pT dependence! Rick Field – Florida/CDF/CMS
Particle Ratios versus PT • CMS NSD data on the Lambda+AntiLambda to 2Kshort ratio versus pT at 7 TeV (|Y| < 2) compared with PYTHIA Tune Z1 & Z1C. • ALICE INEL data on the Lambda+AntiLambda to 2Kshort ratio versus pT at 900 GeV (|Y| < 0.75) compared with PYTHIA Tune Z1 & Z1C. Tune Z1C is not too bad but a bit off on the pT dependence! Rick Field – Florida/CDF/CMS
Particle Ratios versus PT • CMS NSD data on the Cascade-+AntiCascade- to Lambda+AntiLambda ratio versus pT at 7 TeV (|Y| < 2) compared with PYTHIA Tune Z1 & Z1C. • CMS NSD data on the Cascade-+AntiCascade- to 2Kshort ratio versus pT at 7 TeV (|Y| < 2) compared with PYTHIA Tune Z1 & Z1C. Tune Z1C is not too bad but a bit off on the pT dependence! Rick Field – Florida/CDF/CMS
Particle Ratios versus PT Tails of the pT distribution. Way off due to the wrong pT! • ALICE INEL data on the charged kaon to charged pion rapidity ratio at 900 GeV compared with PYTHIA Tune Z1. • ALICE INEL data on the charged kaons to charged pions ratio versus pT at 900 GeV (|Y| < 0.75) compared with PYTHIA Tune Z1 & Z1C. Tune Z1C is not too bad but a way off on the pT dependence! Rick Field – Florida/CDF/CMS
Particle Ratios versus PT Tails of the pT distribution. Way off due to the wrong pT! • ALICE INEL data on the Proton+AntiProton to charged pions ratio versus pT at 900 GeV (|Y| < 0.75) compared with PYTHIA Tune Z1 & Z1C. • ALICE INEL data on the Proton+AntiProton to charged pion rapidity ratio at 900 GeV compared with PYTHIA Tune Z1 & Z1C. Tune Z1C is not too bad but way off on the pT dependence! Rick Field – Florida/CDF/CMS
Fragmentation Summary • Not too hard to get the overall yields of baryons and strange particles roughly right at 900 GeV and 7 TeV. Tune Z1C does a fairly good job with the overall particle yields at 900 GeV and 7 TeV. • PT Distributions: PYTHIA does not describe correctly the pT distributions of heavy particles (MC softer than the data). None of the fragmentation parameters I have looked at changes the pT distributions. Hence, if one looks at particle ratios at large pT you can see big discrepancies between data and MC (out in the tails of the distributions)! • ATLAS Tuning Effort: Fragmentation flavor tuning at the one of the four stages. • Other Fragmentation Tuning: There is additional tuning involving jet shapes, FSR, and ISR that I did not have time to include in this talk. Rick Field – Florida/CDF/CMS