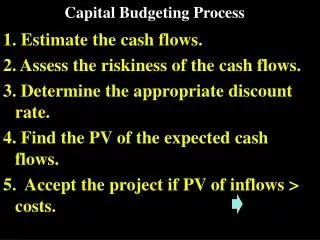
The budgeting process
The budgeting process. The traditional goals of the planning and control process are: - to identify the economic goals and how to achieve them - to measure if the goals have been achieved - to determine the variance causes between the actual values and planned valued

The budgeting process
E N D
Presentation Transcript
The budgeting process • The traditional goals of the planning and control process are: • - to identify the economic goals and how to achieve them • - to measure if the goals have been achieved • - to determine the variance causes between the actual values and planned valued • - to introduce the necessary correction measures • Two basic steps are analyzed in the next lessons: • - the budgeting process or operative planning; • - the variance analysis.
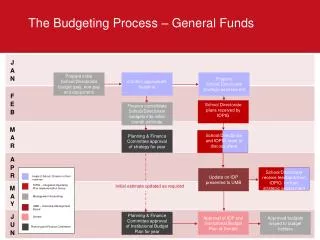
The budgeting process • The budgeting is included in the more general strategic planning process which is composed of the following phases: • - identification of the company’s objectives in terms of product/market segments, strategy and expected development/growing; • - strategic planning, with the definition of the long-term plans necessary to achieve the objectives (new products introduction, existing products modify, efficiency or flexibility increasing); • - budgeting which determines the short-term actions to realize the long-term plans; the activity budgeting receives the input of the long-term strategic planning. From an organizational point of view the coherence between the three phases requires that in the definition of goals and in the strategic planning are involved all responsibility centers
The final goal of the budgeting phase is the drawing up of the MASTER BUDGET, document which allows to prepare the expected Balance sheet (Expected Profit/Loss and Expected Assets and Liabilities Statement) • The Master budget is composed by: • - the operative budgets related to the short-term planning of the operative management; • - the annual investment budget related to the new investment in tangible/intangible resources necessary to achieve the strategic goals; • - the financial budgets to evaluate the impact on the net cash flow due to the operative budgets and investment budget • It can be very complex to draw up a budget which is consistent with the strategic planning and to achieve a coherence between the plans which compose the master budget. Very often a “negotiation process” is necessary (e.g. a growing of the market share through the prices reduction can not be consistent with the expected return on investment; investments in Research and Development can not be consistent with the established dividend distribution; selling choices are not consistent with production capacity) The budgeting goals
The operative budgets • Sales budget • Production budget • Cost of goods sold (purchases, variable and fixed conversion costs) • Period costs budget (commercial costs, general and administrative costs, discretional costs)
Sales budget • It’s the first budget which is the base for the preparation of the other operative budgets and the financial budget • It’s drawing up by the Marketing &Sales function with the support of the Planning and Control Staff Unit • Monthly or yearly the sales budget defines the expected revenues in terms of volumes and prices. Values can be grouped by customer or geographic area • Sales budgets are based on the market evolution forecasting, on the competitive strategy, on the historical growing of sales
Production budget (and ending inventory budget) • After identifying the sales, the opening/beginning inventory and the expected closing/ending inventory in quantity, it is possible to define the expected production quantity for each product in each relevant period (e.g. month): • Pi=Vi + (EI - BI) • It’s necessary to verify the feasibility of the production budget. In other words for each resource must be: • Pi*tij <=Tj for i=1,…N • tij is the quantity of the resourse j required by product i unit • Tj is the total quantity of the resource j that is available (e.g. machine hours, labor hours)
Production budget non feasibility: actions • Reviewing sales policy, for example increasing the price and reducing the quantity • Reviewing the inventory policy, for example decreasing the expected level of ending inventory • Modifying the production capacity through new investment (long-term action) • Purchasing a share of production by the market (outsourcing)
Cost of goods sold • After identifying a feasible production plan, the amount of resources necessary to achieve the production plan must be defined • The Process Engineering Function and the Purchase Function defines the standard quantity and the standard price of the raw materials, direct labor, any other resourced to be used to realize the expected production level • Consequently the following budget can be determined: “consumption” for the production: • - Direct Material budget or consumption of raw material for the production plan that could be different with respect to Budget of purchases = consumption of raw material + desired EI – BI of raw material • - Direct Labor budget, or consumption of labor for the production plan; • - Other Conversion costs (ex. Energy, amortization) budget; • External working budget (if any) • BUT TO DEFINE OPERATING INCOME (P/L) IT’S RELEVANT THE COST OF GOODS SOLD (COMPETENCE PRINCIPLE)
Cost of goods sold • On the full or variableproduction cost base it’s possible to determine the inventory value - raw materials, finished goods - (previously it had been determined the quantity) and then the cost of goods sold as: • Cost of goods sold (variable or full)= raw mat consumption + conversion costs + BI - EI (finished goods) • Cost of goods sold (variable or full)= purchases + conversion costs + BI - EI (raw material and finished goods) • What type of costs can be included in the inventory evaluation? • Production costs as: • Variable approach: raw material, energy, labor if variable according to production level, usually NO selling, administrative and financial costs. Selling costs are included in the variable costs, but as period costs. • Full approach: raw material, energy, labor, amortization (overhead): • All production costs, variable and fixed. • Anyway, we need to calculate the production cost per unit, and then we’ll apply to inventory
Cost of goods sold • TWO profit and loss budgeted statements are linked to these different approaches • Contribution margin= Sales- Variable costs (production and selling) • -Fixed costs (production and selling) • Net Operating margin (income) • Note: variable COGS can include also selling costs, but inventory evaluation does not because they are period costs. Inventory evaluation includes only variable production costs. • 2. Gross (industrial) margin= Sales – Full COGS • Selling & administrative costs (period costs) • Net Operating margin (income) • Note: Full COGS includes only production costs, all included in inventory evaluation
Cost of goods sold IF EI > BI WE POSTPONE/DEFER COSTS AND COGS < PRODUCTION SALES < PRODUCTION IF EI < BI WE UPLOAD COSTS TO THE PERIOD AND COGS > PROD SALES > PRODUCTION VITALE CASE TO UNDERSTAND THE COGS (FULL) IRON (I PART) TO UNDERSTAND THE IMPLICATIONS ON NET OPERATING INCOME DERIVED BY USING VARIABLE OR FULL APPROACH
Cost of goods sold: graphics Direct Material Budget Conversion cost Budget
Period costs budget: two possible approaches • Costs related to Discretional and support activities such as General &Administrative costs, Selling costs, Research and Development costs • Two possible approaches: • - Incremental approach • - Zero based budget approach • According to the incremental approach the budget is determined multiplying the past actual values (of the previous year) by a coefficient based on the inflation rate and the expansion of activity company level. This approach has two limits: • - assumes a linear relation between the activity level and the period costs (it can be wrong for the period costs incurred una tantum) • - derives the budget values from the past year actual values and consequently causes an amplification of inefficiencies
Period costs budget: two possible approaches • According to the zero based budget approach each year the amount of period costs is re-defined • The period costs budget is independent from the past but this approach is more complex and requires the strong commitment of the responsibility centers and Planning & Control Staff • Usually, an incremental approach is used each year and a zero based budget is used each 3/4 year
Variance analysis • The goal of this analysis is the explanations of the difference incurred between the actual costs/revenues and the expected costs/revenues • The analysis is different according to the type of the organizational unit • - cost center (responsible on the use of resources to achieve the output) • - revenue center (responsible on the revenue) • - expense center (e.g. administrative unit): for these centers there is only a total budget control without searching in detail the variance causes
Variance analysis: revenue centers • Sales are the relevant entities for responsibility related to these units • Sales = Pi*V*Qvi i= 1,…..N • Pi=sale price of product i • V= total sales in quantity for all products • Qvi=% of the sales in quantity for product i (sales MIX) • to understand the causes of difference between actual and expected sales 4 entities must be compared. • - budget (standard conditions) • - flexible budget with standard mix • - flexible budget with actual mix • - actual
Variance analysis: revenue centers • Flexible budget standard mix - Budget = variance of volume • Flexible budget actual mix - Flexible budget standard mix =variance of mix • Actual - Flexible budget actual mix = variance of price • EXERCISE
Variance analysis: cost centers There are two different levels of analysis: 1° level Actual - Flexible budget = variance of efficiency (internal cause) Flexible budget - Budget = variance of volume (external cause) NOTES: Flexible budget has an actual production level but a standard consumption of resource (standard efficiency)
2° level • for the direct variable costs (Direct material and Direct labor) is possible to have a higher detail as concerns the variance of efficiency • - 2a) variance of price (basically external, responsible: Purchases Unit) • - 2b) variance of employment (basically internal, responsible: Production Unit) • Between the Flexible Budget and the Actual is necessary to to introduce also the Flexible Budget with ACTUAL consumption • Actual - Flexible Budget is the total variance of efficiency that is composed by: • 2a) Actual -Flexible Budget with actual consumption = variance of price • q*V*p - q*V*pst= (p -pst)*q*V • q= actual quantity of resource j for unit of production • 2b) Flexible Budget with actual consumption - Flexible Budget with standard consumption = variance of employment • pst*q*V - pst*qst*V= (q -qst)*pst*V • EXERCISE Variance analysis: cost centers