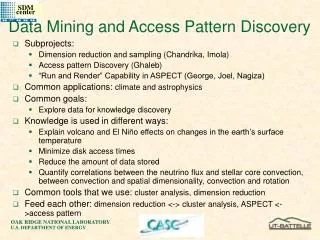
Integrating Discovery, Development, and Commercial Data into Data Mining
220 likes | 345 Vues
This document discusses the integration of discovery, development, and commercial data into data mining processes within the pharmaceutical industry. It outlines the definition of data mining, its importance in identifying business problems, and controlling process variability. The article introduces multivariate data analysis techniques such as the Multi-Item Gamma Poisson Shrinker (MGPS) and discusses drug development issues, including adverse event reporting. The paper highlights statistical methods to predict prescriber behavior and improve drug safety through effective data analysis.

Integrating Discovery, Development, and Commercial Data into Data Mining
E N D
Presentation Transcript
Integrating Discovery, Development, and Commercial Data into Data Mining Jennifer Sloan Data Mining Consultant GlaxoSmithKline: US Pharma IT 15 September 2004
Data Mining Definition Data Mining is a process that uses a variety of data analysis tools to discover patterns and relationships in data that may be used to make valid and accurate predictions.
Data Mining is a toolthat allows us to • Identify problematic areas • Control process variability • Make concrete decisions on business needs • Develop a model which can aid in future business decisions
Commercial Data Analyzing Multivariate Data Managing Data Usage Model Building
Multivariate Data Sets • Data are multivariate in nature • Large data sets containing multiple criteria within each observation • Comparing multiple vectors is nearly impossible without reducing to a single point
Here we view 5-dimensionalinformation on one observation. Each point represents a prescriber and the color represents a Market Share increase or decrease. Overlapping distributions make this difficult to interpret and further analysis is required. Over 200K observations are represented in this graph.
The same observations are observed but now two-way interactions between the variables help us determine which variables are affecting market shifts and lead to constructing models which will predict prescriber behavior.
Drug Development Issues • Adverse Event Reporting System (AERS) Over 2 million AE reports and approximately 2000 drugs and biologics submitted to the FDA since 1968 • Creates ExtremelyComplicated Matrix of Data • Recently, Data Mining methods have helped address this issue with the development of a method used to examine large databases for associations between drugs and AEs
Data Mining Algorithm • Multi-Item Gamma Poisson Shrinker (MGPS) Developed by William DuMochel (AT&T) Through statistical modeling, this Empirical Bayesian method identifies higher-than-expected reporting relationships of drug-event combinations • Automated, web-based system with rapid drill-down capability MGPS runs using all event terms and drugs in the AERS database and produces results for all drug-event combinations
MGPS: Significance • Handles Complex Stratification (age, gender, year of report > 945 categories) • Performs complex computations in minimal amount of time: Much MORE EFFICIENT • Real World Example:
Membership: PhRMA-FDAWorking Group Chair: June Almenoff (GSK) FDA Involvement Involved PhRMA companies: Abbott, Allergan, AstraZeneca, Bristol-Myers Squibb, GlaxoSmithKline, Johnson & Johnson, Lilly, Merck, Novartis, Schering-Plough, Pfizer, Roche, Wyeth
SCAM—Statistical Classification of Activities of Molecules • Recursive partitioning customized for chemistry • Creates a structure activity relationship (SAR) mode7l • Handles large numbers of descriptors (> 1 million)
SCAM : Data Structure Biological Activities Y1 1 0 1 0 1 1 1 0 1 0 0 0 0 0 0 0 0 0 0 0 0 1 Y2 1 0 1 0 0 1 1 1 1 0 0 0 0 0 0 0 0 0 0 0 0 1 Y3 1 0 1 0 1 1 1 1 1 0 0 0 0 1 0 0 0 1 0 0 0 1 Y4 1 0 1 0 0 1 1 0 1 0 0 0 0 0 1 0 0 1 0 0 0 1 ... ... 1 0 0 0 1 1 1 1 0 1 0 1 0 0 0 1 0 0 0 0 0 1 Yn > 2 million >100K
rP = 2.03E-70 aP = 1.30E-66 Signal 2.60 - 0.29 t = = = 18.68Noise 0.734 1 1 36 1614 + SCAM’s Recursive Partitioning n = 1650 Ave = 0.34 SD = 0.81 Feature n = 1614 ave = 0.29 sd = 0.73 n = 36 ave = 2.60 sd = 0.9
Advantages of SCAM • Works for complex situations, mixtures and interactions. • Output is easy to understand and explain • High statistical power • Produces avalid answer
SCAM Drawbacks • Data greedy • Only one view of the data • Binary descriptors may be too “crude” • Disposition of outliers is difficult • Highly correlated variables may be obscured • Higher order interactions may be masked
Concluding Remarks • Data Mining enables us to efficiently handle LARGE amounts of data • Data Mining allows us to perform analyses IN REAL TIME • Data Mining covers a wide array of topics in drug industry and its benefits are plentiful
Almenoff, June S, et al. “Disproportionality Analysis Using Empirical Bayes Data Mining: A tool for the Evaluation of Drug Interactions in the Post-Marketing Setting.” Pharmacoepidemiology and Drug Safety,12, 517-521 (2003). Donahue, Rafe. “An Overview of Data Mining in Drug Development and Marketing.” http://home.earthlink.net/~rafedonahue. May 2003. Hawkins, D.M. and G.V. Kass, “Automatic Interaction Detection.” Topics in Applied Multivariate Analysis, ed. Hawkins, (1982). Hawkins, D.M., S.S. Young and A. Rusinko. “Analysis of a Large Structure-Activity Data Set Using Recursive Partitioning.” QSAR, 16, 296-302 (1997). References
![Knowledge Discovery in Data [and Data Mining] (KDD)](https://cdn2.slideserve.com/4256051/knowledge-discovery-in-data-and-data-mining-kdd-dt.jpg)