Download
1 / 47
470 likes | 603 Vues
2010 Water Supply Plan, Water Rate and Connection Charge Study City Council Study Session. September 8, 2010. Agenda. Purpose of Meeting Water Supply Situation Impact on City Demand Forecast Conservation Plan for New Development

E N D
2010 Water Supply Plan,Water Rate and Connection Charge StudyCity CouncilStudy Session September 8, 2010
Agenda • Purpose of Meeting • Water Supply Situation • Impact on City • Demand Forecast • Conservation Plan for New Development • Off-site Conservation Funded by New Conservation Offset Charge • Other Strategies to Satisfy Demand • Comparison of Strategies • Meeting Demand at Buildout
Agenda (cont.) • Needed Capital Improvements • Allocation of Costs to New Development • Water Connection Charges and Comparisons • Billing System and Rate Structure • Financial Models and Key Assumptions • Financing Alternatives and Comparison • Recommended Financing Alternative (Alt. 4) • Impact on SF Customer and Comparisons • Water Shortage (Drought) Surcharge • Recommendations
Purpose of Meeting • Provide update on water supply situation and water supply projects • Provide brief update on water demands, demand projections and water conservation • Presentation of 2010 Water Supply Plan and Water Rate and Connection Charge Study prepared by John Olaf Nelson • Obtain input from the Council and the general public
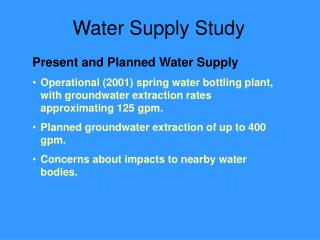
Water Supply: Importance of Local Groundwater Supply • Constitutes 5 to 15% of City’s water supply picture • Conjunctive use strategy • Drought contingency supply • Emergency supply
Other Sonoma Valley Groundwater Projects Active in the Groundwater Management Plan Meetings SC Water Agency Groundwater Banking Feasibility Study SC Water Agency Stormwater Capture and Recharge Project City of Sonoma Well #7 monitoring for groundwater depression
Water Supply Situation • Biological Opinion (BO) Impacts • Limits access to Warm Springs storage (Lake Sonoma) • Increases cost of Russian River (RR) water • Lake Mendocino Storage Issues • Increased demands • Reduced diversions from Eel River • Inadequate storage for Fall fish runs in some years
Water Supply Situation (cont.) • SCWA’s response: • Abandon The Water Project • Calls for reduction of RR diversions from June - September in some years • Fix BO limitations with In-stream improvements • Build Dry Creek Bypass, if needed • Focus on conservation, recycled reuse and groundwater alternatives • Action Plan based on limiting RR diversions to 75,000 afa and renegotiation of Restructured Agreement • City’s response: • Demand management through water conservation • Increased reliance on local groundwater • 2008 Water Supply Action Plan
Impact on City • Peak month delivery capacity limited to 3.46 mgd vs. 6.3 mgd Entitlement1 • Annual delivery limit of 2,617 af vs. 3,000 af Entitlement1 • Potential BO and Lake Mendocino storage issues resulting in reductions in Aqueduct deliveries of up to 25% during June - September in some years • Increased cost of water purchased from SCWA2 • City must look to its own resources to meet increased demands of growth envisioned in General Plan Notes: 1.Cal. Year 2009 Demand (a depressed demand year): Pk Mo 2.73 mgd Annual - 2065 af 2. 11% per yr average for past 4 years Caution: 3.46 mgd capacity could be reduced.
Demand Forecast Remaining New Development1 • Notes: • Based on City’s 2020 General Plan. • Buildout estimated to occur in year 2031.
Demand Forecast (cont.) Projected Demand Including Remaining New Development Notes: 1. Determined by regression model of historic data. 2. Includes 8% for Unaccounted-for Water (UFW). Deducting UFW leaves balance of 456 af.
Conservation Plan for New Development • Notes: • Paid for by new Conservation Offset Charge. • Predicted increase in demand of 456 af is cut in half.
Conservation Plan (cont.) 1. Funded by proposed Conservation Offset Charge
Conservation Plan (cont.) Other Strategies Considered to Satisfy Demand Notes: Cost incomplete. Does not include rehab/modification of storage or pump station. Does not include connection from ST Plant to Watmaugh Rd. 2. Participation and persistence of use unknown. Pilot programs recommended.
Comparison of Strategies Comparison of Various Strategies - Unit Cost over 30 years Discount Rate = 3.0%
Comparison of Mixes of Strategies Comparison of Mixes1 <== NDS = New Development Standards CU = SDC and VOM Conjunctive Use Proj. RW = Recycled Water Proj. Notes: All three alternatives include cost of watershed restoration (in-stream improvement projects) and Dry Creek Bypass. Updated cost of project is $518.9 M (including instream improvement projects and Bypass. $33,4 M is Sonoma’s estimated share.
Meeting Demand at Buildout – Dry Years Comparison of Various Water Year Conditions Notes: BO impact could be addressed as early as 2016 or as late as 2030. Extreme case assumes hot dry year coincides with worst supply limitation.
Meeting Demand at Buildout - Conclusions • Without BO limitations, strategy mix provides surplus in Normal, Single Dry and Multiple Dry Years • With BO limitations, minor deficits of 1 to 2%, except for Extreme Case condition where deficit of 3 to 14% result • With resolution of Dry Creek flow problem, deficits drop to 3 to 5% • During Extreme Case conditions, well production will be increased to maximum capacity. Also an additional 85 af might be available from the SDC CU Project.
Calculation of New Capacity Charge and Conservation Offset Charge
SF Rate Structure Design Table S6 33
Comparison of Financing Plans Table S7 37
Recommended Rates Table S8 39
Impact of Rates on SF Customer Table S9 40
Comparison of Current Rates Fig S4 41
Questions 47