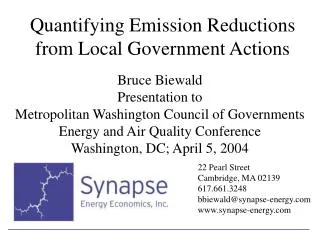
Quantifying Emission Reductions from Local Government Actions
100 likes | 226 Vues
This presentation by Bruce Biewald at the Energy and Air Quality Conference outlines the methodologies for quantifying emission reductions achieved through local government actions, particularly in energy efficiency and renewable energy sectors. It highlights key challenges in emissions calculations, such as geographic and time scales, and the complexities of electricity markets. Biewald emphasizes the need for robust methodologies to support State Implementation Plan (SIP) credits and presents tools developed for calculating avoided emissions, aiming to enhance understanding and practical analysis in emission reduction strategies.

Quantifying Emission Reductions from Local Government Actions
E N D
Presentation Transcript
Quantifying Emission Reductions from Local Government Actions Bruce Biewald Presentation to Metropolitan Washington Council of Governments Energy and Air Quality Conference Washington, DC; April 5, 2004 22 Pearl Street Cambridge, MA 02139 617.661.3248 bbiewald@synapse-energy.com www.synapse-energy.com
Challenges in Emissions Reductions Calculations • Geographic scale. Electric grids are large regional interconnected systems. • Time scale. Resource additions and retirements are made on the basis of complex financial and strategic considerations. • Complexity. Electricity markets are complicated, subject to physical constraints, economic factors, and market rules (while emission rates vary greatly by generator and time period. • Cost. Computer models can be expensive. Synapse Energy Economics
Interconnected Grid Synapse Energy Economics
Resource additions and retirements over the long-term Synapse Energy Economics
Electric dispatch simplified week Synapse Energy Economics
PJM NOx and SO2 Profiles Synapse Energy Economics
Synapse Project for the Ozone Transport Commission Objectives: • Advance the understanding of emission reductions from energy efficiency and renewables in quantitative terms. • Move toward a methodology robust enough to stand behind SIP credit, if desired. • Review models and methods for calculating avoided emissions from energy efficiency and renewables. • Develop a tool for calculating avoided emissions. • Tool should be able to assess energy efficiency, renewables, EPSs and multi-pollutant proposals. Synapse Energy Economics
The OTC Emissions Workbook • Can calculate predicted emission reductions from energy efficiency, renewables, EPSs and multi-pollutant proposals • Based in MS Excel. Simple, quick, good for scenario analysis • Has default data in it – users can use this or enter their own input assumptions • Default data were developed using a system dispatch model. The workbook itself is simple – only adds, subtracts, multiplies and divides. • Does not forecast additions and retirements. Designed for scenario analysis. Synapse Energy Economics
Resources from the OTC project • Ozone Transport Commission web site has available: • OTC Emission Reduction Workbook (Excel file). • OTC Emission Reduction Workbook: Description and Users Manual. • Multi-Pollutant Approaches in Certain OTR States. • Predicting Avoided Emissions from Policies that Encourage Energy Efficiency and Clean Power. • www.otcair.org • www.synapse-energy.com Synapse Energy Economics
It can be done! • Select a study region that is manageable size but large enough to include the significant impacts. • Understand the economic and other dynamics driving capacity mix changes over time. • “Dispatch models” are available to simulate in great detail the operation of a regional electricity system (e.g., PROSYM). • Use the OTC Workbook or hire a good consultant. Synapse Energy Economics