Download
1 / 37
390 likes | 640 Vues
Diabetes and Obesity in Latino Children. Leonel Villa-Caballero MD, PhD Family and Preventive Medicine School of Medicine UCSD. Agenda. The current epidemic in the U.S. Risk factors for DM and obesity Diagnosis of diabetes and obesity Situation in Latinos Cultural differences

E N D
Diabetes and Obesity in Latino Children Leonel Villa-Caballero MD, PhD Family and Preventive Medicine School of Medicine UCSD
Agenda • The current epidemic in the U.S. • Risk factors for DM and obesity • Diagnosis of diabetes and obesity • Situation in Latinos • Cultural differences • Health disparities and sociodemographic status • Successful Therapeutic strategies • Culturally sensitive approach
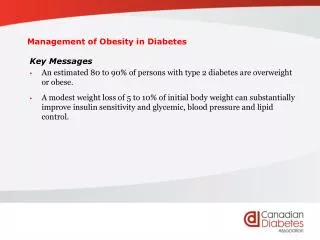
The Prevalence of Diabetes and Obesity Diabetes Mean body weight • Prevalence of obesity, increased by 61% since 1991 • More than 50% of US adults are overweight • The Gene for obesity may be linked to the gene for type 2 diabetes • 90 % of people with type 2 diabetes are overweight Prevalence (%) kg Year
1990 1995 2001 Diabetes Trends* Among Adults in the U.S.,(Includes Gestational Diabetes)BRFSS, 1990,1995 and 2001 Source: Mokdad et al., Diabetes Care 2000;23:1278-83; J Am Med Assoc 2001;286:10.
What is diabetes? • Diabetes is an disease of the metabolism characterized by defective production/action of insulinand the way body tissues uses glucose (sugar). • The food we eat is broken down by digestive juices to create polysaccharides, chylomicrons and peptides and minerals to facilitate digestion. • Diabetes is characterized by high glucose levels in the blood.
What glucose levels are normal? • Normal: 70-100 mg/dL • AbnormaL : >100mg/dL (“Prediabetes”) • Diabetes : > 126mg/dL ADA .Clinical practice recommendations. Diabetes in children .Diabetes Care 2006 Suppl 1;S26-27
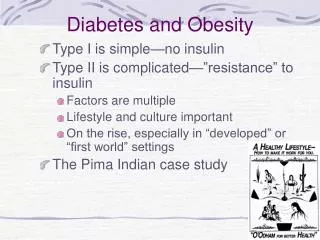
How many types of diabetes are? • Type 1 Diabetes • Childhood or Adolescence • Usually Thin, thirsty, constantly tired • Complete absence of insulin production • Tendency to develop Diabetic Ketoacidosis • Type 2 Diabetes • Mature Age(>40 years) • Overweight or Obese individual • Progressive defects in insulin activity or production • Hyperosmolar state • Gestational Diabetes* (During Pregnancy) ADA .Clinical practice recommendations. Diabetes in children .Diabetes Care 2006 Suppl 1;S26-27
40 20 0 40–59 years 60 years Prevalence of Complications in Type 2 Diabetes Prevalence of Retinopathy in Type 2 Diabetes New Cases of End-Stage Renal Disease Age Range of Amputations per 10,000 DM patients 200 300 160 200 120 Patients (%) (per million/population) 80 100 40 0 0 Caucasian Mexican-American African-American Klein et al. In: Harris et al, eds. Diabetes in America, 2nd ed. 1995. Reiber et al. In: Harris et al, eds. Diabetes in America, 2nd ed. 1995. USRDS. Am J Kidney Dis. 1994;24:879.
Prevalence of overweight and obesity among school-age children in global regions Obesity and overweight defined by IOTF criteria. Children aged 5-17 years. Based on surveys in different years after 1990. Source: IOTF, 2004)
Obesity Definition Excessive adipose tissue located in different organs in the human body. This abnormality is caused by an imbalance between the caloric intake of energy (Kcal) and energy consumed or expended (MJoules/day) with deleterious effects on general health • IOTF and WHO have documented epidemic levels of obesity(James 2001) • Obesity is associated with atherosclerosis, hypertension, diabetes, cancer, cerebrovascular disease, osteoarthritis and osteoporosis (Roth and Qiang,2004)
Obesity Is Caused by Long-Term loss of Energy Balance FatStores
CDC Charts for BMI, boys and girls ages 2-20 Undernutrition :< 5th BMI percentile Normal: 6-84th BMI percentile Risk of overweight :>85th-94th BMI percentile Overweight: > 95th BMI percentile
Prevalence of MS in adolescents 12-18 years in the U.S. 1988-2000 Duncan GE : Diabetes care 2004;27:2438-2443
Which are the Risks Factors for Diabesity? • Increase in Visceral Adiposity, Obesity • Sedentary Lifestyle • Genetic predisposition* Positive Family History of Diabetes • Acculturation
Fatness, Fitness and Cardiovascular Disease Mortality Aerobically fit Unfit Relative Risk of CVD Mortality Lean<16.7% Normal16.7%-24.9% Obese>25% Body Fat Category (% Weight as Fat) Lee et al. Am J Clin Nutr 1999;69:373.
Every 2 hrs of TV watching increases 23% Obesity 13% Diabetes p< 0.001 Mu et AL,JAMA 2003; 289: 1785-1791
Food choices and Super-sizes • Plenty of Saturated Fats and Carbohydrates • Huge Portions! • Cheap, available food everywhere • Early Start! (357gms) 960 Cal 46g Carbs 63 g Fat 1420 mg Na (116gms) 370 Cal 43g Carbs 20gFat 240 mg Na
US Latino Population, 1995 to 2050 • Latinos will add the largest number of people to the US population each year • By 2020, will add more people to the US population than all other ethnic groups combined • Of the increase of 1.3 million, 800,000 was because of natural increase (births minus deaths) and 500,000 was because of immigration. Population Projections of the United States by Age, Sex, and Hispanic Origin: 1995 to 2050. Bureau of the Census, 1996.
The Racial and Ethnic Diversity of the US Population Will Continue to Increase % of Total Population Non-HispanicWhite Hispanic(of any race) African American Asian US Census Bureau. US interim projections by age, sex, race, and Hispanic origin. 2004. Available at: http://www.census.gov/ipc/www/usinterimproj/. Accessed on December 21, 2005.
Cultural Differences. The Latino Case • 45% of Latino patients report communication problems-not just the language-. • Unwillingness to seek care due to language barriers • Poor understanding of the disease and treatment • Defective communication between Health care provider and patient • Culture is more than only speak a different language (gender roles, dietary habits, emotional issues, specific concerns about treatment)
Cultural Differences. The Latino Case • Family dynamics and disease (Gender roles, machismo) • Personal values: respeto (respect),simpatia(kindness) interés personal (interest) • Limited economic resources, low rate of health insurance • Insulin fear and rejection* • Myths and misconceptions (CAM use) • Depression
Practical strategies to solve language barriers • Bilingual/Bicultural staff • Interpreters • Language skills training for staff • Written translations • Phone-based services • Identify community leaders
Surgery Pharmacotherapy Lifestyle Modification Diet Physical Activity Obesity Treatment Pyramid
Goals of Medical Nutrition Therapy • Achieve blood glucose goals • Achieve optimal lipid levels • Provide appropriate calories for: - Reasonable weight - Normal growth and development - Pregnancy and lactation • Prevent, delay or treat nutrition-related complications • Improve health through optimal nutrition Diabetes Care 22(1):S42-S45,1999
Impact of Weight Loss on Risk Factors 1 1 2 2 3 3 3 3 4 1. Wing RR et al. Arch Intern Med. 1987;147:1749-1753. 2. Mertens IL, Van Gaal LF. Obes Res. 2000;8:270-278. 3. Blackburn G. Obes Res. 1995;3 (Suppl 2):211S-216S. 4. Ditschunheit HH et al. Eur J Clin Nutr. 2002;56:264-270.
Diabetes Prevention Program 2.8 year follow-up 31% * 58%* Casos / 100 persona-anos Lifestyle modification Placebo Metformin *All pair-wise comparisons significantly different by group sequential log-rank test The Diabetes Prevention Program Research Group. New Engl J Med 2002;346:393-403 Ann Intern Med 2005;142:323-332.
Decreasing Television Viewing Leads to improved Body Mass Index in Children Change in BMI (kg/m2) Change in TV viewing (h/wk) P<0.001 P=0.002 6-monthintervention Control 6-monthintervention Control Robinson JAMA 1999;282:1561.
Effect of Decreasing Sedentary Activities vs Increasing Physical Activities on Body Weight in Children 6-12 Years Old Increased Physical Activity Change in Percent Overweight Decreased Sedentary Activity 0 4 8 12 Time (months) Epstein et al. Health Psychol 1995;14:109.
Guidelines for Increasing Physical Activity • Assessment 1) Medical and psychological readiness 2) Physical limitations 3) Current activities 4) Barriers to activity • Develop physical activity plan • Start activity slowly and gradually increase planned aerobic activity to 200 min/wk • Enhance compliance • Programmed vs lifestyle activity • At-home vs onsite activity • Multiple short bouts vs single long bout of activity
Recommendations T1Diabetes : • Check hypoglycemic unawareness, intellectual maturity and self -control • Glucose control goals • Microalbuminuria > 10 y if DM1>5 a. • Hypertension if SBP-D >percentila 90 age and height. Drugs: ACE’s • Eye exam >10a. • If LDL >160mg/dL initiate drug therapy ADA .Clinical practice recommendations. Diabetes in children .Diabetes Care 2006 Suppl 1;S26-27
Recommendations for T2 Diabetes diagnosis in children • Overweight (>BMI percentile 85 th o more than 120% of ideal BW) • Family History of Diabetes • Ethnic group AA, NA, HA o de las IP • >10 y puberty • Acantosis nigricans, polycistic ovary, hypertension, hyperlipidemia • Every 2 years fasting gluose* ADA statement: Diabetes 2 in Children and adolescents .Diabetes Care 2000;23:281-289
Summary • Diabetes and obesity are very common among Latinos • Latinos have higher rates of diabetic retinopathy, ESRD, amputations • There are genetic and environmental factors that influence the prevalenceof obesity metabolic syndrome and diabetes among Latinos
Summary • There are cultural differences between Latinos and other ethnic groups that may impact health outcomes • A culturally-sensitive approach is necessary to overcome barriers • Appropriate diet and physical activity must be encouraged by a multi-disciplinary team