Download
1 / 34
340 likes | 466 Vues
State of the Railway World. Louis S. Thompson Railways Adviser The World Bank Bucharest Workshop April 22, 2002. Reform is vital everywhere. Railway Deficits Regional Pressures Globalization Failure and collapse are possible

E N D
State of the Railway World Louis S. Thompson Railways Adviser The World Bank Bucharest Workshop April 22, 2002
Reform is vital everywhere • Railway Deficits • Regional Pressures • Globalization • Failure and collapse are possible • The particular dilemma of the former socialist countries – especially accession candidates • > Paradigm Change: what do we need railways for?
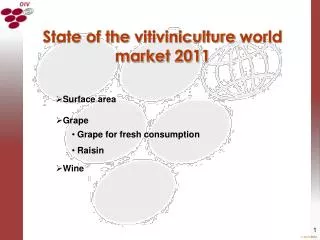
Industry as Percent of GNP: Change 1990 to 1998 versus percentage in 1990 Reduction in % Industry, 1990 to 1998 Industry as Percent of GNP in 1990 Conclusion: socialist countries had the highest percent of GNP as industry in 1990, and they showed the highest reduction in industry percentage between 1990 and 1998
Ton-Km trends by Western railways Note: Germany after 1993 includes DR traffic
Rail Share of Rail + Truck Traffic (%) versus Average Rail Length of Haul1998 Regression: Developing and Developed
Ratio of: 99 output/employee to 88 output/employee % Output (000 TU)/Employee EUROPE CEE CIS Labor productivity in 1999 and compared with 1988
However measured, there is labor redundancy Output (000 TU)/employee Percent TU which is T-Km: T-km/(T-km + P-Km) in %
Services, structure and competition • Intercity, Suburban/Regional and Freight are different markets, need focused management • Get rid of non-core • Organization options emerging: • Monolithic (the old, existing) • Dominant operator controls infrastructure, incremental user pays for access • Infrastructure separation: all users pay for access • Ownership – can be public, private, or partnerships
Competition on Parallel Tracks: U.S. Class I Railroads
Competition on the Same Tracks: Multiple Use U.S. Freight Tracks (Excluding Amtrak)
Structure and ownership interactions Ownership Structure No single solution, mixtures possible, not static
Competition objectives • IN the Market • Parallel tracks (U.S. for example) • Trackage rights (U.S. and Canada) • Competitive access (E.U., Canada, possibly China and Russia) • FOR the Market • Exclusive concessions, positive or negative, for PSO-type services such as commuters. Can include operating subsidies and investments
Very wide experience with change • Latin America – mostly freight and passenger concessioning, but some privatization • Africa -- concessioning • E.U. -- privatization and franchising • CEE countries – restructuring and accession • Japan -- privatization • India, China, Russia – restructuring to meet market competition • Experience has been strongly (with exceptions) positive
Revenue (US$/Ton-Km) before and after concessioning Before Concessioning After Concessioning
Labor productivity before and after concessioning(000,000 TU/Employee) Before Concessioning After Concessioning
Form of the suburban and metro concessions in Latin America • Stated system to be operated • Stated tariff policy (maximum) • Stated service quality required (quantity, frequency, on-time, cleanliness, etc) • Defined capital program in total – bidder chose the timing • Competition for minimum cost to Government of subsidy and capital program (12% NPV) • Awarded in the 1994/1996 timeframe • Demand growth (200 to 400%), productivity up 300 to 400%
Buenos Aires suburban railways Sarmiento Line S S (TBA) M Mitre Line ZARATE M (TBA) CAMPANA Urquiza Line ESCOBAR U (Metrovias 1/94) M M EXALTACION Roca Line TIGRE DE LA CRUZ BN R SAN FERNANDO (Trainmet 4/95) GRAL. SARMIENTO PILAR SM San Martín Line VTE. SAN ISIDRO SM LOPEZ (Trainmet 4/94) SAN Retiro MARTIN Belgrano Norte Line TRES DE BN U LUJAN (Ferrovias 4/94) FEBRERO Constitución CAPITAL Belgrano Sur Line MORENO FEDERAL BS MORON (Trainmet 5/94) AVELLANEDA GENERAL RODRIGUEZ S S 95 Km MERLO MERCEDES LANUS LOMAS QUILMES DE ZAMORA BERAZATEGUI BS MARCOS PAZ ESTEBAN ECHEVERRIA ALTE. ENSENADA BROWN FLORENCIO LA VARELA BERISSO MATANZA GENERAL LAS HERAS R R LA PLATA SAN VICENTE CAÑUELAS R BRANDSEN LOBOS S S R 130 Km
Buenos Aires subway 20 Km Mtro. Carranza Retiro L.N. Alem F. Lacroze Pza. de Mayo Pra. Junta 17 Km Constitución Plaza de City of Buenos Aires los Virreyes Centro Cívico Gral. Savio
Concessioned Rio suburban system (Supervia)
Concessioned Rio Metro (Oportrans)
Arg. Brazil Ridership response to concessioning(1993=100) Note: Belgrano Sur removed in order to enhance detail of others.
Lessons • Many approaches “work”– so don’t do nothing • Get objectives and expectations right • Mixed approaches can be best – avoid dogma • Get agreements right, but allow for change • Resolving social issues – especially labor – is critical to success