Trigonometric Functions: Graphing and Applications
Learn about radians, trigonometric functions graphing, and modeling periodic behavior. This guide covers amplitudes, periods, and properties of sine, cosine functions with practical examples. Enhance your math skills and problem-solving strategies.

Trigonometric Functions: Graphing and Applications
E N D
Presentation Transcript
Trigonometric Functions Graphing the Trigonometric Function
E.Q: E.Q1. What is a radian and how do I use it to determine angle measure on a circle?2. How do I use trigonometric functions to model periodic behavior? CCSS: F.IF. 2, 4, 5 &7E; f.tf. 1,2,5 &8
Mathematical Practices: • 1. Make sense of problems and persevere in solving them. • 2. Reason abstractly and quantitatively. • 3. Construct viable arguments and critique the reasoning of others. • 4. Model with mathematics. • 5. Use appropriate tools strategically. • 6. Attend to precision. • 7. Look for and make use of structure. • 8. Look for and express regularity in repeated reasoning.
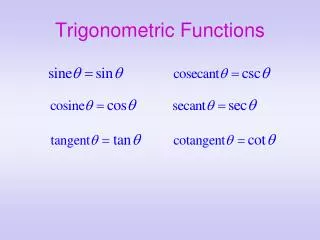
SOH CAH TOA CHO SHA CAO Right Triangle Trigonometry Graphing the Trig Function
Graphing Trigonometric Functions • Amplitude: the maximum or minimum vertical distance between the graph and the x-axis. Amplitude is always positive 5
y y = sin x x y = sin x y = 2 sin x y = –4 sin x reflection ofy = 4 sin x y = 4sin x Amplitude The amplitude of y = a sin x (or y = a cos x) is half the distance between the maximum and minimum values of the function. amplitude = |a| If |a| > 1, the amplitude stretches the graph vertically. If 0 < |a| > 1, the amplitude shrinks the graph vertically. If a < 0, the graph is reflected in the x-axis.
Graphing Trigonometric Functions • Period: the number of degrees or radians we must graph before it begins again. 7
For b 0, the period of y = a sin bx is . For b 0, the period of y = a cos bx is also . period: period: 2 y x y period: 2 x period: 4 Period of a Function The period of a function is the x interval needed for the function to complete one cycle. If 0 < b < 1, the graph of the function is stretched horizontally. If b > 1, the graph of the function is shrunk horizontally.
sin θ 3π −2π −π θ π 0 −3π 2π One period 2π Sine is a periodic function: p = 2π sin θ: Domain (angle measures): all real numbers, (−∞, ∞) Range (ratio of sides): −1 to 1, inclusive [−1, 1] sin θis an odd function; it is symmetric wrt the origin. sin(−θ) = −sin(θ)
x 0 sin x 0 1 0 -1 0 y = sin x y x Sine Function Graph of the Sine Function To sketch the graph of y = sin x first locate the key points.These are the maximum points, the minimum points, and the intercepts. Then, connect the points on the graph with a smooth curve that extends in both directions beyond the five points. A single cycle is called a period.
x 0 cos x 1 0 -1 0 1 y = cos x y x Cosine Function Graph of the Cosine Function To sketch the graph of y = cos x first locate the key points.These are the maximum points, the minimum points, and the intercepts. Then, connect the points on the graph with a smooth curve that extends in both directions beyond the five points. A single cycle is called a period.
cos θ θ π 0 −2π 2π −3π −π 3π One period 2π Cosine is a periodic function: p = 2π cos θ: Domain (angle measures): all real numbers, (−∞, ∞) Range (ratio of sides): −1 to 1, inclusive [−1, 1] cos θis an evenfunction; it is symmetric wrt the y-axis. cos(−θ) = cos(θ)
Properties of Sine and Cosine graphs • The domain is the set of real numbers • The range is set of “y” values such that -1≤ y ≤1 • The maximum value is 1 and the minimum value is -1 • The graph is a smooth curve • Each function cycles through all the values of the range over an x interval or 2π • The cycle repeats itself identically in both direction of the x-axis 13
Given : Asin Bx • Amplitude = IAI • period = 2π/B • Sine Graph • Example: y=5sin2X • Amp=5 • Period=2π/2 = π π π/2 π/4 3π/4
x 0 2 3 0 -3 0 3 y = 3 cos x max x-int min x-int max y (0, 3) ( , 3) x ( , 0) ( , 0) ( , –3) Example: y = 3 cos x Example: Sketch the graph of y = 3 cos x on the interval [–, 4]. Partition the interval [0, 2] into four equal parts. Find the five key points; graph one cycle; then repeat the cycle over the interval.
y = sin(–x) x y y x y = cos (–x) Graph y = f(-x) Use basic trigonometric identities to graph y = f(–x) Example : Sketch the graph of y = sin(–x). The graph of y = sin(–x) is the graph of y = sin x reflected in the x-axis. Use the identity sin(–x) = – sin x y = sin x Example : Sketch the graph of y = cos(–x). The graph of y = cos (–x) is identical to the graph of y = cos x. Use the identity cos(–x) = + cos x y = cos (–x)
2 2 period: = 3 y ( , 2) x (0, 0) ( , 0) ( , 0) ( ,-2) x 0 0 2 –2 y = –2 sin 3x 0 0 Example: y = 2 sin(-3x) Example: Sketch the graph of y = 2 sin(–3x). Rewrite the function in the form y = a sin bx with b > 0 y = 2 sin (–3x) = –2 sin 3x Use the identity sin (– x) = – sin x: amplitude: |a| = |–2| = 2 Calculate the five key points.
Tangent Function Recall that . Since cos θ is in the denominator, when cos θ = 0, tan θ is undefined. This occurs @ π intervals, offset by π/2: { … −π/2, π/2, 3π/2, 5π/2, … } Let’s create an x/y table from θ = −π/2 to θ = π/2 (one π interval), with 5 input angle values. und 0 −1 −1 1 0 0 1 0 1 und
tan θ θ −π/2 π/2 0 One period: π Graph of Tangent Function: Periodic Vertical asymptotes where cos θ = 0 −3π/2 3π/2 tan θ: Domain (angle measures): θ≠π/2 + πn Range (ratio of sides): all real numbers (−∞, ∞) tan θis an odd function; it is symmetric wrt the origin. tan(−θ) = −tan(θ)
To graph y = tan x, use the identity . y Properties of y = tan x 1. Domain : all real x x 4. Vertical asymptotes: period: Tangent Function Graph of the Tangent Function At values of x for which cos x = 0, the tangent function is undefined and its graph has vertical asymptotes. 2. Range: (–, +) 3. Period:
Example: Find the period and asymptotes and sketch the graph of y 1. Period of y = tanx is . x 3. Plot several points in Example: Tangent Function 2.Find consecutive vertical asymptotesby solving for x: Vertical asymptotes: 4. Sketch one branch and repeat.
Cotangent Function Recall that . Since sin θ is in the denominator, when sin θ = 0, cot θ is undefined. This occurs @ π intervals, starting at 0: { … −π, 0, π, 2π, … } Let’s create an x/y table from θ = 0 to θ = π (one π interval), with 5 input angle values. Und ∞ 1 0 1 0 1 0 −1 Und−∞ –1 0
Graph of Cotangent Function: Periodic Vertical asymptotes where sin θ = 0 cot θ −3π/2 -π −π/2 π/2 π 3π/2 cot θ: Domain (angle measures): θ≠πn Range (ratio of sides): all real numbers (−∞, ∞) cot θis an odd function; it is symmetric wrt the origin. tan(−θ) = −tan(θ)
y To graph y = cot x, use the identity . Properties of y = cot x x 1. Domain : all real x 4. Vertical asymptotes: vertical asymptotes Cotangent Function Graph of the Cotangent Function At values of x for which sin x = 0, the cotangent function is undefined and its graph has vertical asymptotes. 2. Range: (–, +) 3. Period:
Cosecant is the reciprocal of sine Vertical asymptotes where sin θ = 0 csc θ θ 0 −3π −π π −2π 2π 3π sin θ One period: 2π sin θ and csc θ are odd(symm wrt origin) csc θ: Domain: θ ≠ πn (where sin θ = 0) Range: |csc θ| ≥ 1 or (−∞, −1] U [1, ∞] sin θ: Domain: (−∞, ∞) Range: [−1, 1]
To graph y = csc x, use the identity . y Properties of y = csc x 1. domain : all real x x 4. vertical asymptotes: Cosecant Function Graph of the Cosecant Function At values of x for which sin x = 0, the cosecant functionis undefined and its graph has vertical asymptotes. 2. range: (–,–1] [1, +) 3. period: where sine is zero.
Vertical asymptotes where cos θ = 0 sec θ θ 0 2π 3π −3π π −2π −π cos θ One period: 2π Secant is the reciprocal of cosine sec θ: Domain: θ ≠ π/2 + πn (where cos θ = 0) Range: |sec θ | ≥ 1 or (−∞, −1] U [1, ∞] cos θ and sec θ are even(symm wrt y-axis) cos θ: Domain: (−∞, ∞) Range: [−1, 1]
The graph y = sec x, use the identity . y Properties of y = sec x 1. domain : all real x x 4. vertical asymptotes: Secant Function Graph of the Secant Function At values of x for which cos x = 0, the secant function is undefined and its graph has vertical asymptotes. 2. range: (–,–1] [1, +) 3. period: 2
Translations of Trigonometric Graphs • Without looking at your notes, try to sketch the basic shape of each trig function: 1)Sine: 2) Cosine: 3)Tangent:
More Transformations • We have seen two types of transformations on trig graphs: vertical stretches and horizontal stretches. • There are three more: vertical translations (slides), horizontal translations, and reflections (flips).
More Transformations • Here is the full general form for the sine function: • Just as with parabolas and other functions, c and d are translations: • c slides the graph horizontally (opposite of sign) • d slides the graph vertically • Also, if a is negative, the graph is flipped vertically.
More Transformations • To graph a sine or cosine graph: • Graph the original graph with the correct amplitude and period. • Translate cunits horizontally and d units vertically. • Reflect vertically at its new position if a is negative (or reflect first, then translate).
Examples • Describe how each graph would be transformed:
Examples • State the amplitude and period, then graph: x -2π 2π
Examples • State the amplitude and period, then graph: x -2π 2π
Examples • State the amplitude and period, then graph: x -2π 2π
Examples • Write an equation of the graph described: • The graph of y = cos x translated up 3 units, right πunits, and reflected vertically.