Single period returns Eg. 01
150 likes | 339 Vues
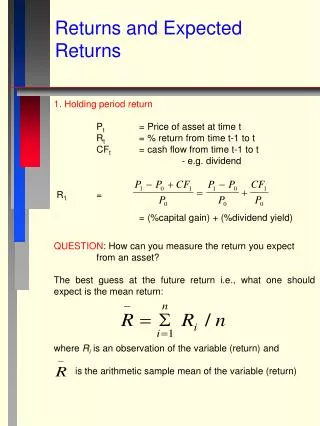
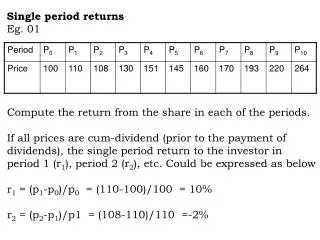
Single period returns Eg. 01. Compute the return from the share in each of the periods. If all prices are cum-dividend (prior to the payment of dividends), the single period return to the investor in period 1 (r 1 ), period 2 (r 2 ), etc. Could be expressed as below

Single period returns Eg. 01
E N D
Presentation Transcript
Single period returns Eg. 01 Compute the return from the share in each of the periods. If all prices are cum-dividend (prior to the payment of dividends), the single period return to the investor in period 1 (r1), period 2 (r2), etc. Could be expressed as below r1 = (p1-p0)/p0 = (110-100)/100 = 10% r2 = (p2-p1)/p1 = (108-110)/110 =-2%
The average annual return (single period return) over the period 0 to 10 1/n∑ ri =(r1+r2+r3+…+r10)/n = 10% Multi-period returns Period p0 p1 p2 Prices 100 200 110 What is the annual return over the two years period. r1= 100% and r2= -45% The average annual return= 27.5%
The single period return over the period 0 to 2 (r0-2) is arrived at as follows. r0-2 = (p2-p0)/p0 = (110-100)/100 = 10% This return (r0-2) can be reduced to an equivalent per period return (r) P0(1+r)2 = p2 or r = (p2/p0)1/2 – 1 = (1.1)1/2 – 1 = 4.88% Alternatively (1+r)2 = 1+r0-2 or r = (1+r0-2)1/2 -1 = 4.88% Thus r is the annual rate of return on a time adjusted basis Annual rate of return without adjusting for time r0-2/n = 10/2 = 5%
Measuring historical (Ex-post) returns ABC Ltd XYZ Ltd Price as on 01.01 (Rs.) 20.00 10.00 Price as on 31.12 (Rs.) 15.00 15.00 Dividend for the year 1.00 1.00 Return holding the stock of ABC Ltd. & XYZ Ltd. for one year. ABC = {(15-20)+1}/20 =-4/20 = -20% XYZ = {(15-10)+1}/10 = 6/10 = 60%
Expected return (Ex-ante) of a security Eg. 01 Scenario Chance Return(%) 1 0.25 36 2 0.50 26 3 0.25 12 E(x) = (0.25*36 + 0.50*26 + 0.25*12) =25% Conditional Pro.of occu. XiPi Return(%)(Xi) (Pi) -24 0.05 -1.20 -10 0.15 -1.50 0 0.15 0.00 12 0.20 2.40 18 0.20 3.60 22 0.15 3.30 30 0.10 3.00 9.60
Expected return of a portfolio of securities Weighted average of the return on individual securities in the portfolio. Expected portfolio return, Ep = W1E1+W2E2 Portfolio of n assets, Ep = ∑ WiEi Price 31.12 30 40 60 130 Yearly Divi. 2 3 5 10 Rate of Return 60.00% 43.33% 30.00% 40% Stocks X Y Z (XYZ) Price 01.01 20 30 50 100
Risk Returns of shares M & N for last five years Share M 30% 28% 34% 32% 31% Share N 26% 13% 48% 11% 57% Select only one share for your investment. Using average return 31% (same for both) What is riskiness of returns? Variability of security returns Most common measures of riskiness of a security are Standard deviations Variance of returns
The variance is computed as 2 = P1(r1-E)2+P2(r2-E)2+ … +Pn(rn-E)2 = (variance)1/2 Scenario Chance Return(%) 1 0.25 36 2 0.50 26 3 0.25 12 Ex (P.fx) 9 13 3 25 Scenario Chance Return (P) (fx) 1 0.25 36 2 0.50 26 3 0.25 12 Devi. (fx-Ex) 11 1 -13 (Devi)2 (fx-Ex)2 121 1 169 P(fx-Ex)2 30.25 0.50 42.25 Ex
Variance (2x) =73.00 x = 8.54% Reduction of risk through diversification Consider an alien planet Delta, which in a given year is either under a spell of hot wave, or a cold wave, either of which is equally likely to prevail. Only two companies available in the market are an Ice cream firm & a hot coffee firm. Ice cream Hot Coffee Hot wave dominate 30% 10% Cold wave dominate 10% 30% On average 20% 20% Variance (same for both)
Do the securities move in the same direction or in opposite directions? In either case, what is the strength of the relationship? Correlation coefficient is the answer for above questions. Two returns move exactly opposite to each other -1 Two returns have a tendency to move in the same direction +1 Security X & Y with the following attributes Expected return on security X 20% Expected return on security Y 30% of security X 10% of security y 16% 40% invested on X Coefficient of correlation -1,0.5, +1
Portfolio risk = p = 2p 2p = w2121 + w2222 + 2[w1w21,2] 1,2 = Co-variance between returns on stocks, X and Y Correlation coefficient ρ1,2 = 1,2/12 2p = w2121 + w2222 + 2[w1w2 ρ1,212 ] Whenρ1,2 = +1 2p=(40%)2(10%)2+(60%)2(16%)2+2[(40%)(60%)(1)(10%)(16%)] = 13.6%
When Coefficient of Correlation is 0.5 Risk of the portfolio is 12.1% When Coefficient of Correlation is -1 Risk of the portfolio is 5.6% The weighted average risk is 13.6% Risk after diversification is 12.1% If we invest all our funds in X; E(x) is 20% and risk is 10% If we invest all our funds in Y; E(y) is 30% and risk is 16% Thus 6% additional risk for 10% additional return If there were no gain from diversification, as we move our money from X to Y, on an average, for every 1% additional return, we have to take 0.6% additional risk.
According to our example return rose from 20% to 26% and the risk from 10% to 12.1%, implying that there was only a 0.35% increase in risk for every 1% increase in return Diversification allows us to get additional return with less than commensurate increase in the risk level. Two assets case 1 2 1 w2121 w1w212 2 w1w212 w2222 Variance of the portfolio with two assets is merely the sum of the expressions in the four smaller boxes above.
When there are n assets in a portfolio there are (n2-n)/2 unique co-variances. Calculate the co-variance between the stocks of ACD Co. & AMB Co. Mean Standard deviation ACD Co. 0.86 7.45 AMB Co. 0.94 6.28 ρ= 0.46 0.46 = CovACD.AMD/7.45*6.28 CovACD.AMD = 21.52 Covij = ρijij
Calculate the variance & standard deviation for a portfolio containing stocks 1 & 2 Ρ1,2 =0.75 1=10.00 2=20.00 W1=2/3 W2=1/3 Variance = 155.56 S.D = 12.47%