Download
1 / 35
350 likes | 514 Vues
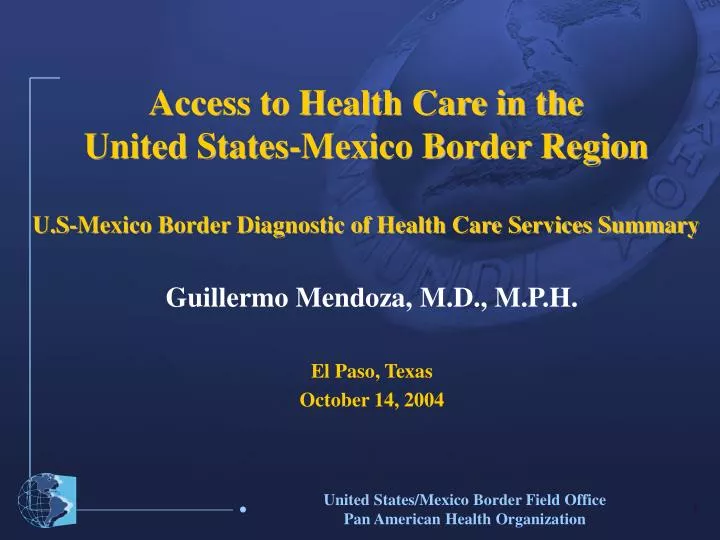
Access to Health Care in the United States-Mexico Border Region U.S-Mexico Border Diagnostic of Health Care Services Summary. Guillermo Mendoza, M.D., M.P.H. El Paso, Texas October 14, 2004. Diagnostic of Health Care Services. Demographics Health Care Coverage Human Resources Facilities

E N D
Access to Health Care in theUnited States-Mexico Border RegionU.S-Mexico Border Diagnostic of Health Care Services Summary Guillermo Mendoza, M.D., M.P.H. El Paso, Texas October 14, 2004
Diagnostic of Health Care Services • Demographics • Health Care Coverage • Human Resources • Facilities • Financial Resources www.fep.paho.org/publications
Mexico Demographics Local border counties are characterized by immigration of young adults impacting the demand of both public and individual health services
México Cobertura por la Seguridad Social Fuente: XII Censo General de Población y Vivienda. 2000
México Cobertura de Servicios Con No Especificado Sin
Demographics The population of border communities is predominantly Hispanic. While Hispanics represent 12.5% of the nation’s population and 31.9% of Border States’ population, in border counties 47.8% of the population is Hispanic.
United States Demographics. The population of border counties is predominantly urban. In fact, 83% of the population of border counties lives in the counties of San Diego, Pima, El Paso, Hidalgo and Cameron.
United States Demographics. Rural border counties are characterized by migration of youth.
United States Demographics Jeff Davis, Texas Population by Five-Year Groups and Gender, 2000 Age Group 90 + MEN WOMEN 75 - 79 60 - 64 45 - 49 30 - 34 15 - 19 0 - 4 150 100 50 0 50 100 150 POPULATION Source: Profile of General Demographic Characteristics. Census 2000 Kinney, Texas Age Groups Population by Five-Year Groups and Gender, 2000 90 + MEN WOMEN 80 - 84 70 - 74 60 - 64 50 - 54 40 - 44 30 - 34 20 - 24 10 - 14 0 - 4 150 100 50 0 50 100 150 POPULATION Source: Profil of General Demographic Characteristics. Census 2000
United States Health Coverage In the year 2000, 14.6% of the U.S. population lacked any type of health insurance, compared to 19.6% of the Border States population. An average of 28.5% of the population of border counties lacked health insurance during the same year (double than the nation’s figures).
United States Healthcare Coverage by Type of InsuranceSister Cities, Healthcare Coverage by Government Insurance2000-2001
United States Healthcare Coverage Hispanics are the largest ethnic group with out any type of health insurance. Nationwide, in the year 2000, 35% of Hispanics less than 65 years old had no medical insurance compared to 12% in White non-Hispanic.
United States Healthcare Coverage Also, Hispanics are the ethnic group with the smallest health coverage through health insurance provided by employers (44% vs. 74% in White non-Hispanic)
United States Human Resources Border States and border counties had 20% less health and social assistance employees per thousand people than the national average (40.8 and 39.1 per thousand inhabitants vs. 50.1 employees per one thousand inhabitants).
United States Human Resources United States Four States 25 counties in border with Mexico Texas New Mexico California Arizona Per Thousand Inhabitants Source EMPLOYEES IN HEALTHCARE AND SOCIAL ASSISTANCE. 2000.
United States Human Resources Texas and New Mexico border counties have less health workers than the national and state average. In fact, Texas border counties have almost half of the national’s average for physicians per one thousand inhabitants; half of the national’s average for registered nurses; and less than half of the national’s average for dentists.
United States Human Resources In 1999, only 3.1% of U.S. physicians were Hispanic. In Border States, although Hispanic population almost tripled national figures, only 4.4% of physicians were Hispanic.
United States Human Resources In 2000, the average salary for health and social assistance workers in the United States was $30,579. In the Border States the average salary was $31,261; while for the border counties the average salary was $27,429 (10% less than the national average). In Texas border counties the average salary was 22,241 (27% less than the national average and 29% less than the Border States average). Source: http://censtats.census.gov
United States Financial Resources Source: http://www.census.gov/prod/3/98/98pubs/98stabtab
United States Financial Resource Medicare and Medicaid Financing, 2000