
Validation of the Regional Ocean Modeling System in the California Current System
This study assesses the Regional Ocean Modeling System (ROMS) in simulating sea surface temperatures (SST) in the California Current System. Initial comparisons using the Pathfinder AVHRR dataset revealed insufficient spatial resolution to accurately identify upwelling events, leading to the pursuit of alternative SST datasets with higher resolution. Additionally, efforts are underway to enhance the analysis methods through collaboration with the San Diego Supercomputing Center, focusing on quantitative validation of ocean modeling efforts in the Northeast Pacific Ocean using various data formats.

Validation of the Regional Ocean Modeling System in the California Current System
E N D
Presentation Transcript
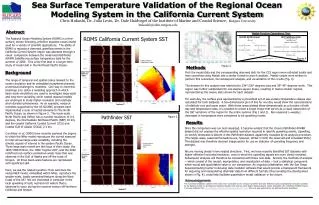
Sea Surface Temperature Validation of the Regional Ocean Modeling System in the California Current System Methods Results Abstract Acknowledgements Once the comparison was run and visualized, it became evident that the chosen Pathfinder AVHRR dataset did not possess the effective spatial resolution required to identify upwelling events. Upwelling on weekly timescales is absent in this Pathfinder dataset, apparently excluded by its analysis procedure. (The larger-scale, seasonal fluctuations are, however, similar in both the observed and simulated SSTs.) This dataset was therefore deemed inappropriate for use an indicator of upwelling frequency and strength. We are moving ahead in two related directions. First, we have recently identified SST datasets with higher effective horizontal resolution, ones in which the upwelling signals are more clearly revealed. Subsequent analyses will therefore be conducted with these new data. Second, the methods of analysis -- which consist of the receipt, manipulation, and visualization of data -- lack a statistical component which would add quantitative value to our comparison. An ongoing collaboration with the San Diego Supercomputing Center to develop data mediator software that would provide a transparent framework for acquiring and manipulating dissimilar data from different formats (thus avoiding the development shown in Fig. 4), could help facilitate quantitative model validation in the future. The numerical simulations utilized in this study were conducted by Drs. Enrique Curchitser and Kate Hedstrom using computational resources provided by the National Center for Atmospheric Research (Boulder, CO) and the Arctic Region Supercomputer Center (Fairbanks, AK). Pathfinder AVHRR Product #216 was obtained from http://podaac.jpl.nasa.gov/products/product216.html. This work was supported by the National Science Foundation. First the model data and the corresponding observed data for the CCS region were collected locally and then converted using Matlab into a similar format to permit analysis. Matlab scripts were written to perform this conversion, the subsequent analysis, and visualization of the results (Fig. 4). The domain for this analysis was restricted to 234°-236° degrees east and 39°-45° degrees north. This region was further subdivided into one-degree square boxes, resulting in twelve smaller regions, represented as the twelve plots shown for each dataset. For each day, the surface area represented by a prescribed set of sea-surface temperature classes was calculated for both datasets. A two-dimensional plot of this for one day would show the concentrations of relatively cool and warm water. With these areas plotted three-dimensionally as a function of both day and temperature class, it is possible to create a single image that serves as a visual description of the SST variations of the region for the entire summer (Fig 1 and 2). Non-seasonal (~weekly) decreases in temperature were considered to be upwelling events. The Regional Ocean Modeling System (ROMS) is a free-surface, terrain-following, primitive equation ocean model used for a variety of scientific applications. The ability of ROMS to reproduce observed upwelling events in the California Current System region was assessed through a visual comparison between the model and Pathfinder AVHRR Satellite sea surface temperature data for the summer of 2000. This is the first step in a longer-term study of model skill in the Northeast Pacific Ocean. Background The range of temporal and spatial scales relevant to the ocean circulation and its embedded ecosystems presents a technical challenge to modelers. One way to meet this challenge is to utilize a modeling approach in which basin-scale simulations are used to investigate large-scale and long-term variability, while nested regional models are employed to study higher-resolution and relatively short-duration phenomena. As an example, research scientists supported by the US GLOBEC program have implemented a suite of nested domains for the North Pacific Ocean, as shown in Figure 3. The basin-scale North Pacific grid (NPac) has a nominal resolution of 0.4 degrees, the intermediate Northeast Pacific (NEP) 10 km, and the coastal California Coastal Current (CCS) and Coastal Gulf of Alaska (CGOA) 2-3 km. Curchitser et al. (2006) have recently explored the degree to which the NPac model reproduces the correct seasonal to inter-annual large-scale variability, including the climatic signals of interest in the eastern Pacific Ocean. Three large-scale events are the focus of their study: the 1997/1998 El Nino, the 1999 “regime shift”, and the 2002 cold/fresh sub-surface anomalous water mass that was observed in the Gulf of Alaska and off the coast of Oregon. All three basin-scale features are reproduced with significant skill. Here, we ask the related question: How well does the nested NEP model, embedded within NPac, reproduce the smaller-scale, locally generated features along the West Coast of the US? We are interested in particular in the local upwelling of cold, nutrient-rich waters that is observed to occur during the summer season off Northern California and Oregon. ROMS California Current System SST # Data Points in Temperature Class Days Since June 15, 2000 Pathfinder SST Figure 2 # Data Points in Temperature Class Days Since June 15, 2000 Chris Hukushi, Dr. Julia Levin, Dr. Dale Haidvogel of the Institute of Marine and Coastal Science, Rutgers University hukushi@eden.rutgers.edu Matlab Function Dependency Tree NetCDF ROMS Output HDF Pathfinder Data (Hierarchical Data Format) nep_read pathfinder_read or pathfinder_quality_filter get_nep_temp_class get_nep_avg_temp get_pathfinder_temp_class get_pathfinder_avg_temp nep_surface_analysis nep_average_analysis pathfinder_surface_analysis pathfinder_average_analysis nep_slurp pathfinder_slurp Figure 4 plotting functions Figure 3


