Regression With Categorical Variables
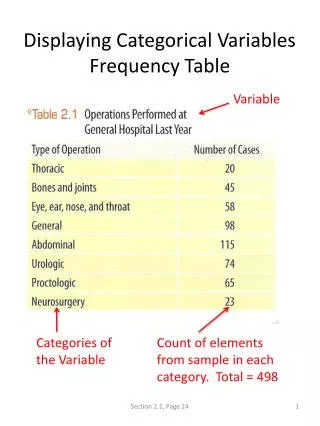
Regression With Categorical Variables. Overview. Regression with Categorical Predictors Logistic Regression. Regression with a Categorical Predictor Variable. Recall that predictor variables must be quantitative or dichotomous.


Regression With Categorical Variables
E N D
Presentation Transcript
Overview • Regression with Categorical Predictors • Logistic Regression
Regression with a Categorical Predictor Variable • Recall that predictor variables must be quantitative or dichotomous. • Categorical variables that are not dichotomous can be used, but first they must be recoded to be either quantitative or dichotomous.
Ways to Code a Categorical Variable • Dummy Coding • Effect Coding • Orthogonal Coding • Criterion Coding
Dummy Coding • Test for the overall effect of the predictor variable • 1 indicates being in that category and 0 indicates not being in that category; need one fewer dummy variables than categories
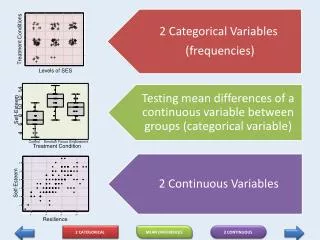
Dummy Coding Example • We are trying to predict happiness rating using region of the country as a predictor variable • Three regions: • Northeast • Southeast • West
Dummy Coding Example • Dummy Variable 1: Northeast = 1 Southeast = 0 West = 0 • Dummy Variable 2: Northeast = 0 Southeast = 1 West = 0 • We don’t need a third dummy variable, because West is indicated by 0’s on both dummy variables
Effect Coding • Compare specific categories to each other • Use weights to indicate the intended contrast
Orthogonal Coding • Same as Effect Coding, except that the contrasts are orthogonal to each other • You can do a maximum of k-1 orthogonal contrasts, where k is the number of categories
Criterion Coding • Overall relationship between predictor and criterion variable • Each individual is assigned the mean score of the category
Regression with a Categorical Outcome Variable • Logistic Regression • The outcome variable (Y) indicates whether or not the individual falls in a particular category • 0 = not in category • 1 = in category
Why is it Logistic? • One of the assumptions for linear regression is a linear relationship between X and Y • When Y is categorical, it can’t have a linear relationship with X • A logarithmic transformation can make the relationship appear linear
Logistic Regression Methods • Similar to options for linear Multiple Regression • Use hierarchical/forced entry to test a theory • Use stepwise (backward or forward) to search for the best fitting model
Evaluating the Model • Log-likelihood statistic measures amount of unexplained data • Compare model to baseline model • Baseline model: predict that everyone will be in the category that is most frequent • Is there significant improvement in prediction?
Evaluating the Model • -2LL is the log-likelihood statistic multiplied by -2 so that it yields a c2 distribution and significance can be determined • Model chi-square indicates the difference between -2LL with predictor(s) and -2LL in the baseline model • Significant model c2 means that the model is helping to predict the outcome variable
Evaluating the Model • When there are multiple steps in the analysis, the step c2 indicates whether there was improvement in the model from the previous step
Evaluating the Model • Positive value of R means that increases in X (or combination of X variables) are associated with increased probability of the case being in the category (Y = 1) • Nagelkerke’s R2 can be interpreted similar to R2 in linear Multiple Regression
Evaluating Predictor Variables • B is the regression coefficient • The Wald Statistic indicates whether B is significantly different from 0
Evaluating Predictor Variables Exp (B) is the change in odds that the case will be in the category from a one-unit change in X
Reporting a Logistic Regression We conducted a logistic regression to predict likelihood of voting from age, education, and TV watching. The model explained a significant portion of variance, c2 (3) = 196.6.1, p < .001, NagelkerkeR2 = .18. As shown in Table 1, all three variables were significant predictors of voting behavior.
Choosing Stats College students are asked to indicate whether they have Facebook accounts or not and whether they have engaged in binge drinking in the last month or not. The researcher hypothesizes that those with Facebook accounts are more likely to have engaged in binge drinking.