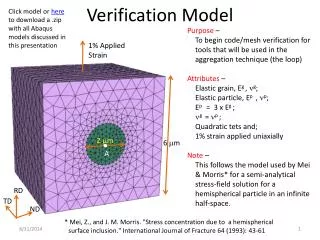

TOWARDS AN ANALYSIS ENSEMBLE FOR NWP-MODEL VERIFICATION
E N D
Presentation Transcript
TOWARDS AN ANALYSIS ENSEMBLE FOR NWP-MODEL VERIFICATION Manfred Dorninger, Theresa Gorgas and Reinhold Steinacker
OUTLINE • Motivation • The analysis tool VERA • The JDC Observational Data Set • The ensemble method • First results • Summary and outlook Dorninger, et al. Joint COPS/CSIP-meeting
Deterministic FC EPS MOTIVATION Verification Forecast Reference (obs., ana.) „truth “ Forecast Uncertainty Dorninger, et al. Joint COPS/CSIP-meeting
observation representative observational (known) (true) value deviation (wanted!) …observation scale …representative scale I subscale bias (e. g. urban heat island) II random subscale effects (meteorological noise) III systematic error (technical, calibration, sensor) IV random error (technical, sensor, data processing) MOTIVATION Dorninger, et al. Joint COPS/CSIP-meeting
Deterministic FC EPS EOS, EAS MOTIVATION Verification Forecast Reference (obs., ana.) „truth“ Forecast Uncertainty Verification Uncertainty Dorninger, et al. Joint COPS/CSIP-meeting
The analysis tool VERA (Vienna Enhanced Resolution Analysis) Does not include first guess fields – „NWP-model independent“ suitable for NWP-model verification BUT • need: • sophisticated QC procedure • very high station density Dorninger, et al. Joint COPS/CSIP-meeting
The analysis tool VERA (Vienna Enhanced Resolution Analysis) Data quality control scheme + Thin-Plate-Spline algorithm + Downscaling via the „Fingerprint“ method Further reading: Steinacker, et al. 2000 (MWR), Steinacker, et al. 2006 (MWR) Analysed Surface Parameters: Potential Temperature Wind Precipitation: Accumulated to 1h, 3h, 6h, 12h, 24h • Post processing: • Mixing Ratio • - Moisture Flux Divergence MSL - pressure Equivalent – Pot. Temperature Dorninger, et al. Joint COPS/CSIP-meeting
Joint D-PHASE and COPS (JDC) data set • Collection of operational network data of National Weather Services initiated in the framework of the WWRP COPS (RDP, Wulfmeyer, et al., 2008, BAMS) and D-PHASE (FDP, Rotach, et al., 2009, BAMS) • Available at WDCC Hamburg following MAP Data Policy (http://cera-www.dkrz.de/WDCC/ui/Index.jsp) DOI in the near future • Task performed in cooperation of U Vienna and U Hohenheim Dorninger, et al., 2009 32 >13300 • 28 data providers • GTS-Stations: 1232 • NGTS-Stations: 10811 • Mean station distance: GTS: ~ 36km • GTS+Non-GTS: ~ 12km • Frames: D-PHASE (large) • & COPS (small) areas Red: Non-GTS stations Blue: GTS stations Dorninger, et al. Joint COPS/CSIP-meeting
Ensemble method Key question: How to define the analysis ensemble ? • the QC scheme of VERA produces a correction proposal every analysis time • this results in 8760 correction proposals for hourly analysis in 2007 deviations of potential temp. for 06/2007 deviations of msl-pressure for 06/2007 Dorninger, et al. Joint COPS/CSIP-meeting
Ensemble method Estimation of uncertainties in VERA analyses - a very first approach Schematic randomisation procedure performed for each station and parameter Steps towards ensemble analyses Correct station observation values by removing biases dereived from deviations proposed by quality control Analyse bias-corrected observations = reference analysis Generate normal distribution fitted to distribution of quality control outputs Create a number of sets of (gaussian) randomized observation values Use perturbated data to create ensemble analyses First experiments: Choose sets for 10 Ensemble Members Dorninger, et al. Joint COPS/CSIP-meeting
2007062112 8km RR [mm/h] 2007062112 8km Pot. Temp. [K] Analysis RR 1h acc. Analysis Pot. Temp. Stdev. of Ens. Members (10) – Max: 2.9 K Stdev. of Ens. Members (10) Dorninger, et al. Joint COPS/CSIP-meeting
Summary and outlook • Observed values do not represent the truth • QC module of NWP-model independent VERA system is used to create ensemble members (perturbations) • uncertainty of analysis highest in regions of strong gradients • joint WWRP COPS and D-PHASE activity to collect fine-scale JDC data set • JDC data are shared at the multi user database at WDCC in Hamburg • correction proposals are not necessarily Gaussian distributed • implementation of “alternative” analysis methods (e.g., Cressman, Barnes, Kriging) to produce “poor man ensemble analysis” • increase number of ensemble members to 50 • define uncertainty of basic verification measures Dorninger, et al. Joint COPS/CSIP-meeting
SPP 1167 Study of the process chain and predictability of precipitation by combining the D-PHASE ensemble and the COPS data sets in the COPS domain VERITA NWP model verification over complex terrain with VERA Thank you for your attention ! Contact: manfred.dorninger@univie.ac.at Dorninger, et al. Joint COPS/CSIP-meeting