
100000
(a). R = 0.9763 p < 0.0001. 100000. 10000. Normalized signal intensity for MB cells treated with HMGA1 siRNA. 1000. 100. 100. 1000. 10000. 100000. Normalized signal intensity for control cells treated with Negative control siRNA. Negative siRNA control.

100000
E N D
Presentation Transcript
(a) R = 0.9763 p < 0.0001 100000 10000 Normalized signal intensity for MB cells treated with HMGA1 siRNA 1000 100 100 1000 10000 100000 Normalized signal intensity for control cells treated with Negative control siRNA Negative siRNA control Negative siRNA control (b) HMGA1 siRNA HMGA1 siRNA 1.8 1.6 1.4 1.2 1.0 Relative mRNA level to those in the negative control siRNA 0.8 0.6 0.4 0.2 0 SKI ID1 ID2 ID3 ID4 SLP1 SPP1 cdc25A TPM1 VNN1 KLRC4 AKR1B1 AKR1C3 HMGA1 AKR1B10 (c) 18 16 14 12 10 Relative mRNA level to those in the negative control siRNA 8 6 4 2 0 EDN1 SOST NPPB PTBP2 ASGR1 PTPRO CCND2 CRMP1 Supplementary Figure S3
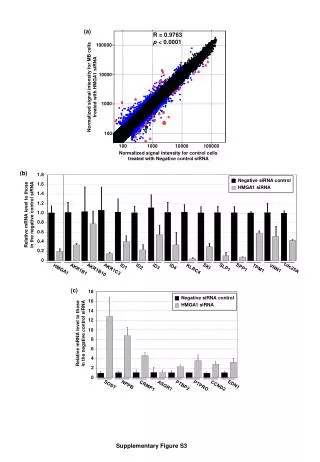
Supplementary Figure S3. Identification of HMGA1-regulated genes in MB cells. (a). A scatter-plot of Agilent whole human gene expression array data of the HMGA1 siRNA-treated versus negative control siRNA-treated DAOY cells. DAOY cells were treated with HMGA1 siRNA or negative control siRNA and the total RNAs were subjected to Agilent whole human gene expression array analysis. The normalized data were presented. The samples are in triplcate. Blue dots ( ) denote genes with >2 folds changes but not statistically significant (p > 0.001); red triangles ( ) denote genes with >2 folds changes but statistically significant (p < 0.001); a solid black star ( ) denotes HMGA1; and a solid green square ( ) denotes cdc25A. (b and c) Results of quantitative RT-PCR of selected candidate genes with down-regulation (b) and up-regulation (c) of the expression by HMGA1 siRNA knockdown. DAOY cells were treated with HMGA1 siRNA or negative control siRNA in triplicate and the extracted total RNAs were subjected to quantitative RT-PCR of these genes and RPS3 as control for normalization. Relative levels of these gene mRNAs to those in negative control siRNA-treated cells are presented. Student t-test was performed for the comparisons. **, p<0.001; Columns, means; bars, standard deviations.