Download
1 / 42
430 likes | 675 Vues
Life expectancy and healthy life expectancy in Scotland. Alison Burlison, ISD ScotPHO team. Life expectancy (LE) and Healthy life expectancy (HLE) Definitions Scotland data and changes over time Methodology and pitfalls Variations within Scotland Scotland compared to other countries.

E N D
Life expectancy and healthy life expectancy in Scotland Alison Burlison, ISD ScotPHO team
Life expectancy (LE) and Healthy life expectancy (HLE) • Definitions • Scotland data and changes over time • Methodology and pitfalls • Variations within Scotland • Scotland compared to other countries
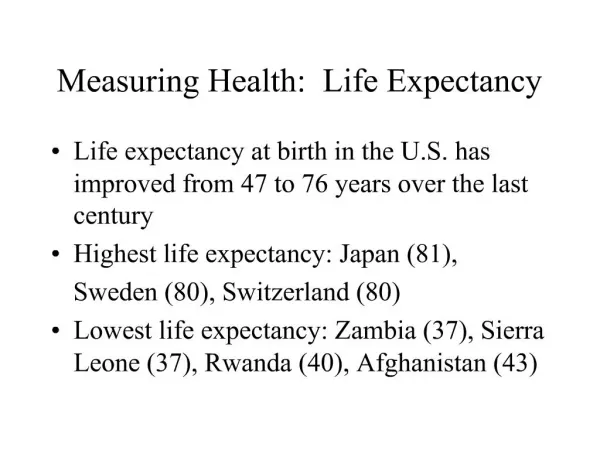
Life expectancy (LE) at birth, for a given time period • Is an estimate of the number of years a newborn baby would survive if they experienced the area’s age-specific mortality rates for that time period throughout their life. • But the baby’s actual LE will vary - with future changes in death rates during their life - if they move to a different area.
Adding the ‘H’… Healthy life expectancy (HLE) at birth • Is an estimate of the average number of years a newborn baby would survive in a ‘healthy’ state if they experienced the particular area’s age-specific mortality rates and self-assessed health (SAH) for that time period throughout their life. LE – HLE = Number of years in ‘not healthy’ health. Can’t assume these are all at the end of life.
} ‘Not healthy’ health
} ‘Not healthy’ health ~9% of life in ‘not healthy’ health
} ‘Not healthy’ health ~12% of life in ‘not healthy’ health
HLE in Scotland With time LE HLE years in ‘not healthy’ health (% life in ‘not healthy’ health unchanged)
Methodology …and pitfalls
HLE calculations for Scotland Deaths registrations(GROS) Population mid-year estimates(GROS) Life tables for calculating period LE and HLE Self-assessed health‘healthy’ versus ‘not healthy’(surveys or Census)
Self-assessed health(SAH) • 2011 Census and Scottish Household Survey from 2009 (EU definition):‘How is your health in general? Would you say it was..... • - very good • good • - fair • bad - very bad?’ 2001 Censusand Scottish Household Survey until 2008: ‘Over the last 12 months would you say your health has on the whole been - good - fairly good - not good?’ ‘healthy’ ‘not healthy’
Life table, with LE calculations based on Chiang (II) and HLE based on Sullivan method: Scotland, males, 2006 ISD/ONS
Pitfalls in HLE calculations (1) Death registrations • residents of Scotland who die in Scotland • non-residents who die in Scotland • residents of Scotland who die outwith Scotland. For sub-Scotland analyses, we impute area of residence for non-residents dying here, to compensate for the loss of residents dying outwith Scotland.
Pitfalls (2) Robustness and availability of SAH data Census • The most robust available estimates of SAH and HLE in 2001 • No comparable time trends • HLE calculations for geographies down to NHS boards and CHPs Scottish Household Survey • HLE trends for Scotland • NOT robust for HLE for NHS boards and CHPs • Only for ages 16+, so need to “patch” it • For females - slightly worse SAH and lower HLE than Census • Disruption in time trends due to question change.
Pitfalls (3) Perils of small areas and populations * Smallest geography where we have calculated HLE = Orkney CHP/NHS board (5-year male pop ~48,000). * For smaller areas – HLE not calculated. – LE only presented for: 5-year populations 5,000 5-year deaths 40. * Smaller population wider CI for LE at birth. >75,000: <2 year 95% CI 30,000: ~ 3 year 95% CI 5,000: ~ 7.5 year 95% CI
Variations within Scotland • NHS boards • Intermediate zones • Deprivation deciles • Urban rural classification
Intermediate zones in Scotland (average M+F population ~4,000) HLE not calculated LE only presented for M or F where: 5-year populations 5,000 5-year deaths 40.
Edinburgh: LE at birth, 2003-2007 Barnton/Cammo area Males 85.5 years(82.4-88.5) Females 90.4 years(88.6-92.2) Greendykes/Niddrie Mains area Males 61.1 years(57.3-65.0) Females 73.7 years(69.5-78.0)
Scottish Government • High-level target to increase HLE in Scotland 2007-2017 National indicator to increase HLE at birth in the most deprived areas • Long-term Monitoring of Health Inequalities HLE a key indicator
HLE in Scotland With increasing deprivation (and urbanisation) LE HLE years or % life in ‘not healthy’ health
GUESS! • Scotland • Denmark • France • Germany • Ireland (Eire) • Portugal
GUESS! • Scotland • Denmark • France • Germany • Ireland (Eire) • Portugal
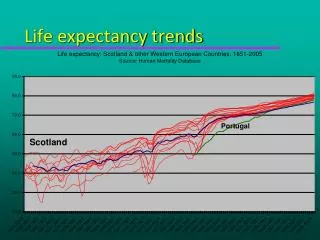
HLE in Scotland Internationally Scotland lowerLE than most Western European countries, and apparently lower disability-freelife expectancy (DFLE) at birth than many. Comparable health data required.
HLE in Scotland 1. With time… LE HLE years in ‘not healthy’ health (% life in ‘not healthy’ health unchanged) 2. With increasing deprivation (and urbanisation)… LE HLE years or % of life in ‘not healthy’ health 3. Internationally… Scot lowerLE than most W European countries (and apparently lower DFLE at birth than many).
www.scotpho.org.uk Healthy life expectancy Health for All