Star formation
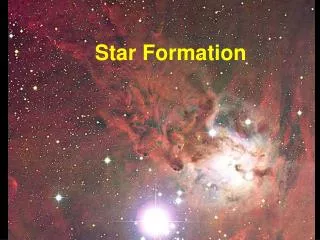
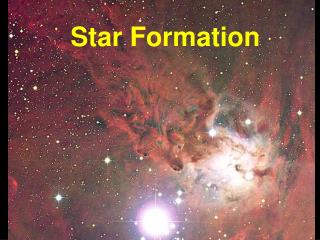
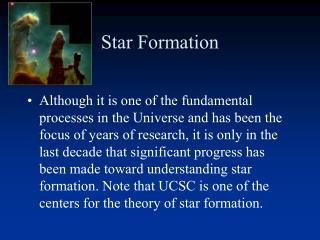
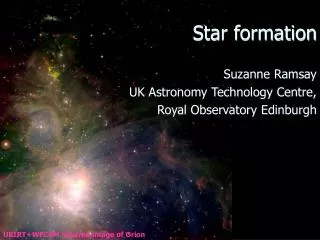
Star formation. Suzanne Ramsay UK Astronomy Technology Centre, Royal Observatory Edinburgh. UKIRT+WFCAM infrared image of Orion. The Challenge. A theory of star formation requires to explain the origins of stars over four orders of magnitude in mass

Star formation
E N D
Presentation Transcript
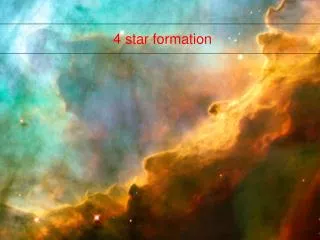
Star formation Suzanne Ramsay UK Astronomy Technology Centre, Royal Observatory Edinburgh UKIRT+WFCAM infrared image of Orion
The Challenge • A theory of star formation requires to explain the origins of stars over four orders of magnitude in mass • From 0.01 M brown dwarfs powered only by gravitational energy • To >100 M stars with lifetimes around 1million years • The typical star has mass ~1 M • So, what do we know and how do we know it?
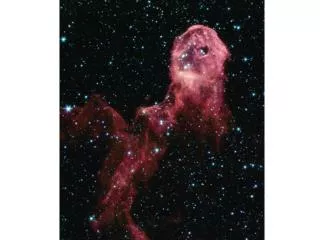
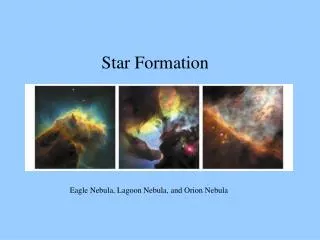
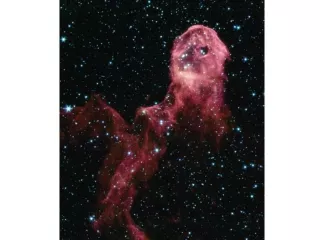
Stars form in molecular clouds • although stars are generally not in clusters young stars are and so these are identified as the sites of star formation From Dame, Hartmann and Thaddeus 2001.
GMC chemistry • >100 molecules discovered in MCs • H2 most abundant • CO commonly studied at 10-4 of H2 abundance since it emits from cold GMC which H2 does not • complex molecules detected include formaldehyde, amino acids. • Important constituent (1% of ISM) is dust (C, Si) – • much cloud chemistry takes place on dust grains • Most dust mass is in grains size ~1000A, 109 atoms
Properties of GMCs • 2-4% of interstellar volume • The rest is the atomic interstellar medium • Lifetime, debatable but <~ 107 years • Free-fall timescale ~ 106 years • Typically dispersed by radiation from massive stars, timescale ~107 years • Supported by magnetic fields and turbulence due to motion of clumps • Observed galactic star formation rate 3 Myr-1 • Star formation in clouds is relatively inefficient: 1-3% of the cloud ends up as stars
Orion B Monoceros R2 Orion A • Within the Orion molecular cloud higher density clumps are readily identifiable
Orion B Monoceros R2 Orion A • Stars form from yet smaller structures - cores • OMC has stars of various ages • At 460pc, the Orion Nebula is our closest laboratory for studying massive star formation
Star formation in clusters • Embedded clusters • T associations e.g. Taurus • R associations (AB stars) e.g. Mon R1 • OB associations (massive stars e.g. BN-KL in Orion) • Open clusters (e.g. Hyades, Pleiades) can be very old
dense cores • Bok globule b335 • typical formation site for an individual star
Some values AV~20mag AK~2mag Much higher for dense cores Extinction
Star formation requires long wavelength astronomy • High obscuration means that many starformation phenomena require long wavelength observations • mm, submm and infrared • Youngest sources are the most deeply embedded and therefore the hardest to study
Evolution of a (low mass) protostar Evolutionary sequence From Andre, Ward-Thompson & Barsony 1993 Extended from original by Lada 1987
Starless cores • Starless core or pre-stellar core • Cold (<~15K) • Sufficient mass for protostar + envelope (0.05-30 M) • Gravitationally bound, but no protostar
Core collapse • Considering the core as an isothermal sphere • Density 1/r2 • Maximum mass for such a sphere is the Bonor Ebert mass • M > MBE, collapse starts with central core M Balances surface pressure from the cloud, velocity dispersion from temperature and gravity.
Core collapse • If unmediated, free fall collapse with Density 1/r3/2 and vff2 1/r1/2 • Requires additional support otherwise • Timescales too fast • Velocities become supersonic and core fragments
Magnetic Support • Clouds are known to contain magnetic fields • These support the cloud against collapse • Mechanism to allow slow collapse required • Ambipolar diffusion • Neutral particles immune to magnetic field drift to the centre of the core • Ionised particles remain fixed by the field lines • Once the core mass reaches critical level, collapse proceeds • AD timescales are too long for standard initial conditions • Effect of AD increased by turbulence
Starless cores • Observed magnetic fields inadequate for ambipolar diffusion model • Turbulent support of the core required Ward-Thompson, Motte, Andre 1999
Class 0 sources • Sources with a central protostar that are very faint/undetectable in the optical/NIR • Lsubmm/Lbol > 0.5% • Menvelope>m* • Tbol < 70K
Class 0 sources • First Class 0 source, VLA1623, discovered in Rho Ophiucus (1993) • Andre, Ward-Thompson, Barsony 1993
Class 0 sources • Sources with a central protostar that are very faint/undetectable in the optical/NIR • Lsubmm/Lbol > 0.5% • Menvelope>m* • Tbol < 70K • The deeply embedded protostar acquires most of its mass during this phase • Bipolar molecular outflows are associated with Class 0 sources • Mechanism for removing angular momentum
Contains embedded source of 3 L Contains a disk, radius 100AU Density profile – inner region of r-1.5 and outer envelope r-2 (to 5000AU) Inner density profile consistent with gravitational free fall B335 revisted H2CO map from Choi. A bipolar outflow is detected from the embedded young source Harvey et al 2003 sub-mm imaging reveals. Disk of radius ~100AU.
Protostellar evolution • Most of the core mass must be ejected to evolve from Class 0 to Class I • During their evolution, Class 0 sources • Increase mass from ~ 0.3 M to 3 M • Mass accretion regulated by deuterium burning • Luminosity reaches 10-100 L
Class I sources IR visible protostars • Sources withair > 0 over the wavelength range from 2.2 to 10-25mm • air is the slope on the spectral energy distribution • These sources have both disks and envelopes • 70K < Tbol < 650K • Identifiable by their large infrared excess • Infrared emission lines detectable • Outflows, less energetic than those from Class 0
Class 0/I sourcestimescales • Time spent in Class I phase – 1-5 105 years from statistical arguments on source numbers • This works under assumption that the various classes are an evolutionary trend • 10 times fewer than Class II • Timescale for Class 0 - 104 years in Rho Oph • 10 times fewer than Class I • Implies mass accretion rate of 10-5 MYr-1 to form half solar mass star
Class II sourcesClassical T Tauris • Sources with -1.5 < air<0 – pre-main sequence sources with large circumstellar disks • Optically visible • H-alpha and forbidden lines from outflow • Stellar photospheric features, but often veiled by disk/dust continuum • Ages 1-4 x 10⁶yr T Tauri. 2MASS Atlas Image mosaics by E. Kopan, R. Cutri, and S. Van Dyk (IPAC).
Strong infrared excess initially hypothesised as an obsuring disk, with later observational confirmation
Class III sourcesWeak line T Tauris • Sources withair<-1.5 – pre-main sequence stars that are no longer strongly accreting • Disks disspipated, so optically visible • ‘weak-lined’ - H-alpha equivalent width < 10 Å • Ages 1-20 x 106yr • Final state for our low mass protostar • Somewhat ambiguous definition as e.g. not all stars with disks have strong H-alpha and vice versa
Accretion and outflow • Outflows and jets are a ubiquitous phenomenon associated with star formation • They appear during all phases, but with trends in their evolution with protostellar class • Class 0 – highly collimated, luminous • Class 1, lower collimation, less energetic • Momentum flux of outflow predicted by modelling to be proportional to mass accretion so Class 0 sources have higher accretion than Class 1
Accretion and outflow HH212 (above) and HH211 (below) are class 0 sources: high collimation, highly luminous molecular outflow
HH-30 HH-47
Outflows and angular momentum transport • Preferred launching mechanism for outflows is magnetic • Capable of explaining high degree of collimation and outflow strength • Material ejected along magnetic field lines from the disk • Field geometry is crucial, but a succesful model can remove a large fraction of angular momentum with a small amount of material • Launch sites: disk; disk-star interface; star’s surface
High mass star formation • Stars above 8 M can’t form by the same process as low mass • Hydrogen burning ignites during accretion phase • Yet they conspicuously exist, though in small numbers compared with low mass stars • Extreme examples • Eta Carinae: 100 M; the Pistol ~150 M; LBV 1806–20 ~130-190 M
High mass star formation • Fundamental difficulties in observing high mass star formation is due to the rarity of the sources, the distance of the nearest examples • Recent intense effort is providing larger samples of candidate HMYSOs based on infrared colours, radio data
High mass star formation • Basic problem – Kelvin Helmholtz timescale exceeds the free fall timescale • tKH~104 years for an O star (~107 for the Sun) • Contraction proceeds faster than accretion of material from the cloud and hydrogen burning begins while still embedded in the cloud • Alternative formation mechanism? E.g. coagulation from lower mass stars
HII regions as signposts • HII regions form once Hydrogen burning ignites producing Lyman continuum photons • Electron free-free emission detected in radio • Embedded HII regions are constrained as compact or ultra-compact HII regions
High mass young stellar objects • ‘hot cores’ (T~100K) observed associated with or as precursors to UCHII regions
High mass young stellar objects • Sub-mm imaging reveals dense cluster of sources analogous to the Trapezium cluster in Orion Outflow activity in the region – SiO jet Beuther et al. 2007
Outflows from HMYSOs • Well know examples of high mass outflows have suggested low collimation compared with low mass sources • Different mechanism for generation or low spatial resolution?
Outflows from high mass sources IRAS20126+4104Varricatt et al. 2008 IRAS18151-1208Davis et al. 2004
Brown dwarfs • Stars with insufficient mass to star hydrogen burning • Mass limit ~0.011-0.013 M (12-14MJup) • Brown dwarfs represent bridge the gap between stars and planets • Stars form from collapsing cloud cores • Planets from coagulation of material in circumstellar disks (during the Class II stage)
Formation of the lowest mass stars • Brown dwarf discoveries • ‘L’ and ‘T’ dwarfs now numerous, identified from their very red colours through 2MASS and Sloan surveys • T dwarfs: M – 80MJup-10MJup, Temp~800K • Surveys with e.g. WFCAM on UKIRT, VISTA promise the discovery of yet cooler, lower mass objects – the (as yet) mythical Y dwarf • NB 2-3 objects for 100s sq degrees of sky
Formation of the lowest mass stars • Statistics suggest that brown dwarfs have much in common with stars • Possible formation mechanisms include • photo-evaporation of cores by HII regions • ejection from star forming cores • fragmentation of low mass prestellar cores • All supported by modelling – which dominates?
Outflow from 2MASSW J1207334-393254 Subarcsecond outflow detected from a 24 Jupiter Mass brown dwarf (Whelan et al. 2007, ApJ, 659, L45.
The initial mass function • From Salpeter (1955) • The relative number of stars produced per unit mass interval • Derived from the observed luminosity function • Power law function of M*g, slope g = -2.35
Turn off at brown dwarf Masses where sources are faint and hard to find Initial mass function Example observed IMF Salpeter mass function
The initial mass function • Salpeter power law slope g = -2.35 • Now updated – • C(M/ M )-1.2 0.1 < M*/ M < 1.0 • C(M/ M )-2.7 1 < M*/ M < 10 • 0.4C(M/ M )-2.3 10 < M*/ M
Determining the Initial mass function using clusters Low end of the IMF needs deep IR observations and observations of open clusters Establishing slope for high Mass stars requires observations Of OB associations
The initial mass function • The IMF for field stars and those in clusters shows it to be the same • confirmation that the stars did form in clusters. • More recently, the core mass function found to be consistent with the stellar IMF • The IMF is robust to a variety of clusters and environments, but so far lacking theoretical basis