Download
1 / 1
10 likes | 112 Vues
Correlation between VAT% and Tumor Size. 70. 60. 50. VAT%. 40. 30. 20. 10. 0. 1. 2. 3. 4. 5. 6. 7. 8. 9. 10. 11. 12. 13. 14. 15. 16. 17. 18. Size (cm). VAT% distribution in RCC patients due to tumor size. 45. 40. 35. 30. 25. VAT%. 39.5. 20. 38.7. 43.4. 43.2.

E N D
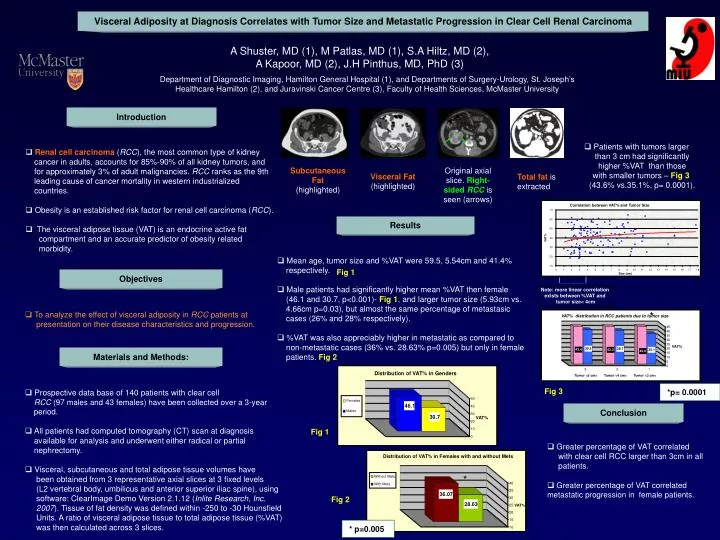
Correlation between VAT% and Tumor Size 70 60 50 VAT% 40 30 20 10 0 1 2 3 4 5 6 7 8 9 10 11 12 13 14 15 16 17 18 Size (cm) VAT% distribution in RCC patients due to tumor size 45 40 35 30 25 VAT% 39.5 20 38.7 43.4 43.2 35.1 43.6 15 10 5 0 3 2 1 Tumor <5 cm> Tumor <4 cm> Tumor <3 cm> Distribution of VAT% in Genders 50 Females 46.1 40 Males 30 30.7 VAT% 20 10 0 Distribution of VAT% in Females with and without Mets Without Mets 40 With Mets 35 36.07 30 28.63 25 VAT% 20 15 10 Visceral Adiposity at Diagnosis Correlates with Tumor Size and Metastatic Progression in Clear Cell Renal Carcinoma A Shuster, MD (1), M Patlas, MD (1), S.A Hiltz, MD (2), A Kapoor, MD (2), J.H Pinthus, MD, PhD (3) Department of Diagnostic Imaging, Hamilton General Hospital (1), and Departmentsof Surgery-Urology, St. Joseph’s Healthcare Hamilton (2), and Juravinski Cancer Centre (3), Faculty of Health Sciences, McMaster University Introduction • Patients with tumors larger than 3 cm had significantly higher %VAT than those with smaller tumors – Fig 3 (43.6% vs.35.1%, p= 0.0001). • Renal cell carcinoma(RCC), the most common type of kidney cancer in adults, accounts for 85%-90% of all kidney tumors, and for approximately 3% of adult malignancies. RCCranks as the 9th leading cause of cancer mortality in western industrialized countries. • Obesity is an established risk factor for renal cell carcinoma (RCC). • The visceral adipose tissue (VAT) is an endocrine active fat compartment and an accurate predictor of obesity related morbidity. Subcutaneous Fat (highlighted) Original axial slice. Right-sided RCC is seen (arrows) Visceral Fat(highlighted) Total fat is extracted Results • Mean age, tumor size and %VAT were 59.5, 5.54cm and 41.4% respectively. • Male patients had significantly higher mean %VAT then female (46.1 and 30.7, p<0.001)- Fig 1, and larger tumor size (5.93cm vs. 4.66cm p=0.03), but almost the same percentage of metastasic cases (26% and 28% respectively). • %VAT was also appreciably higher in metastatic as compared to non-metastatic cases (36% vs. 28.63% p=0.005) but only in female patients. Fig 2 Fig 1 Objectives Note: more linear correlation exists between %VAT and tumor size< 4cm • To analyze the effect of visceral adiposity in RCC patients at presentation on their disease characteristics and progression. * Materials and Methods: *p= 0.0001 • Prospective data base of 140 patients with clear cell RCC (97 males and 43 females) have been collected over a 3-year period. • All patients had computed tomography (CT) scan at diagnosis available for analysis and underwent either radical or partial nephrectomy. • Visceral, subcutaneous and total adipose tissue volumes have been obtained from 3 representative axial slices at 3 fixed levels (L2 vertebral body, umbilicus and anterior superior iliac spine), using software: ClearImage Demo Version 2.1.12 (Inlite Research, Inc. 2007). Tissue of fat density was defined within -250 to -30 Hounsfield Units. A ratio of visceral adipose tissue to total adipose tissue (%VAT) was then calculated across 3 slices. Fig 3 Conclusion Fig 1 • Greater percentage of VAT correlated with clear cell RCC larger than 3cm in all patients. • Greater percentage of VAT correlated metastatic progression in female patients. * Fig 2 * p=0.005