Download
1 / 36
360 likes | 501 Vues
Shrinking the Gap : Potential Roles of the WTO & Trade Agreements. Parr Rosson, Professor & Director Center for North American Studies Department of Agricultural Economics Texas A&M University. C. NAS. US Trade Strategy. Multilateral Trade Negotiations World Trade Organization

E N D
Shrinking the Gap:Potential Roles of the WTO & Trade Agreements Parr Rosson, Professor & Director Center for North American Studies Department of Agricultural Economics Texas A&M University C NAS
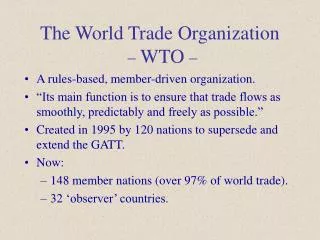
US Trade Strategy • Multilateral Trade Negotiations • World Trade Organization • Regional Trade Agreements • Central American Free Trade Agreement • Bilateral Trade Agreements • US-Australia Trade Agreement
CUSTA, ‘89 Jordan ‘03 Bahrain ‘04 CAFTA ‘04 NAFTA ‘94 Israel ‘85 Morocco ‘04 Thailand ‘05 Panama ‘05 Andean FTA ‘05 Singapore ‘03 Chile ‘04 FTAA ‘06 Australia ‘04 Southern African Customs Union ‘05 U.S. Trade Agreements-3d Largest Market
Why Regional Agreements? • 2d Best Solution After MTN • Slow Progress in WTO • Cancun Ministerial Derailed Progress • FTAA ‘Lite’ Not As Appealing • Economic Incentives • Open Markets • Create Economies of Scale • Increase Business Efficiency
Strategic Considerations • Stem Illegal Immigration • Secure Strategic Materials • Oil/Natural Gas • Fertilizer • Create Buffer Against Terrorism • ‘Seam State’ Argument, Thomas Barnett, U.S. Naval War College (New Rule Sets Project2000) http://www.nwc.navy.mil/newrulesets/
World Population Energy Information Administration, Annual Energy Outlook, 2003. Billions 8 ME AFR CSA TOTAL 7,570 NA WE I. ASIA EE/FSU D. ASIA 8 6,310 Ind. + 8%, Dev. + 31% 6 6 4 4 2 2 0 0 1990 2000 2001 F2005 F2010 F2015 F2020
World Economic Output $70 NA WE I. ASIA EE/FSU $60 D. ASIA ME AFR CSA $50 $40 $30 $20 $10 $0 1990 2000 2001 F2005 F2010 F2015 F2020 Global Insight, Inc., World Economic Outlook, 2002. GDP, Trillion 1997 Dollars Ind. + 64%, Developing + 140%
World Energy Consumption 700 583 NA WE I. ASIA EE/FSU 600 532 D. ASIA 481 434 500 404 399 348 400 300 200 100 0 1990 2000 2001 2005F 2010F 2015F 2020F Energy Information Administration, Annual Energy Outlook 2003, www.eia.gov/iea Quad. Btu Ind. + 28%, Developing + 69% (2001-2020) ME AFR CSA 1 2 2 1
U.S. Oil Imports by Source 12.03 11.46 11.24 11.02 10.16 8.84 8.33 8.02 7.71 6.91 5.07 Petroleum Imports by Country of Origin, 1960-2003. USDOE, EIA, Annual & Monthly Reports NAFTA Non-OPEC (Ex. NAFTA) OPEC 14.00 Million Barrels/Day Million Barrels/Day (Avg.) 12.00 10.00 8.00 6.00 4.00 2.00 0.00 1980 1985 1990 1993 NAFTA 1995 1997 2000 2001 2002 2003
U.S. Crude Oil Imports by Country, 2002 Million Barrels/Day 1.70 1.80 1.51 1.49 1.60 1.40 1.40 1.20 0.98 1.00 0.78 0.80 0.59 0.43 0.60 0.21 0.40 0.20 0.00 Iraq Other Mexico Nigeria Canada North Sea Saudi Arabia South America Other Persian Gulf Source: Energy Situation Analysis Report
U.S. Fertilizer Imports 18.1 17.0 16.6 15.3 14.9 14.6 13.9 13.7 13.6 12.2 10.8 10.8 10.4 USDA, FAS Canada W. Europe ROW 20.0 Million Metric Tons 15.0 10.0 5.0 0.0 1990 1993 1995 2000 2002
U.S. Fertilizer Imports from ROW, 2002 1600 1,000 Metric Tons 1291 1400 1200 1000 800 438 600 394 289 400 216 178 160 88 72 31 200 0 Qatar Egypt Kuwait Bahrain Morocco Lithuania Venezuela Saudi Arabia Russia/Belarus Trinidad/Tobago
Background • The Pentagon’s New Map & Esquire March 2003 • Security in a Post Cold War Era • New Operating Environment • Post September 11, 2001 World • Role of Security in Global Age • Global Disconnect: Gap Between Functioning Core & Nonintegrating Gap Nations
Globalization: What Does It Mean? Integration of Economies & Societies • Global Rule Set • Democracy • Transparency & Rule of Law • Free Trade
Globalization & Development • Does Globalization Have Binary Outcomes? • Great, Everyone Better Off • Horrid, Failing Humanity • Neither, But In Between? • Where Has Globalization Worked? • China, India, 22 Others, + 5% PCI, 3 Billion People • Where Has It Not Worked? • Sub-Saharan Africa, Middle East, Former Soviet Union, Declining PCI, 2 Billion People Source: World Development Report, 2001
Globalization & Security • New Security Paradigm: Disconnectedness Defines Danger • Outlaw Regimes Disconnected from Globalizing World • Few or No Rules • Different Societal Norms • Lack Ties of Mutual Dependence
Assumptions: Old & New • US Military Capable of Handling Threat from Great Power Can Handle Threat from Minor Conflicts in LDCs • September 11 Redefined Perception of the Threat • US Military Response Inversely Related to a Country’s Global Connectedness
Conditions in The Functioning Core • Free Media & Press • Open Financial Transactions • Collective Security • Stable Governments • Rising Living Standards • More Deaths by Suicide than Murder
Conditions in The Non-integrating Gap • Politically Repressive Regimes • Poverty, Hunger & Disease • Routine Mass Murder • Young Population • Chronic Conflicts, Spawning Next Generation of Terrorists
Implications • Global Disconnect Means Foes Not Near Peer, Not Even a Nation • ‘Super Empowered Individuals’ • They Are Products of ‘The Gap’ • To Thwart Threat, ‘Seam States’ are Critically Important • Mexico, Central America, Brazil, Thailand, Malaysia • Seam States Are the “Firewall”
Implications • Shrinking the ‘Gap’ is Crucial • Middle East Is the Starting Point • Policy Goals and Role of Trade? • Security-within nations • Increased Aid (Military, Food, Infrastructure, Development) • Democracy • Freer Trade • Rule of Law • Education (Human Capital)
U.S. Average Tariff, 1789-2002 Percent 70 70 Tariff of Abominations, 1828 Smoot-Hawley Tariff, 1930 60 60 Morrill Act, 1861 50 50 Generalized System of Preferences, 1968 40 40 30 30 WTO, 1995 20 20 Fordney-McCumber Tariff, 1922 10 10 GATT, 1947 0 0 1789 1789 1816 1820 1840 1860 1880 1900 1920 1940 1960 1980 2000 Statistical Abstract of the United States
World Average Agricultural Tariffs, 2000 Percent 140 Bound Average 115 World Average 120 85 100 80 62% 55 60 40 30 25 40 12 20 0 South Asia United States South America North America European Union Central America Caribbean Islands
Doha Development Agenda • Economic Development Issues Affecting Less Developed and Developing Countries at Forefront of Negotiations • Agriculture Negotiations Began in 2000 • Uruguay Round Agreement on Agriculture • After Setback in Cancun-September 2003, Consensus Reached on Work Program, July 31, 2004
Doha Work Program (DWP) • Provides Framework for Negotiations to Proceed • Modalities To Be Negotiated • Procedure & Degree of Trade Liberalization • For Agriculture, Negotiations Center on DDA Reform of the Three Pillars • Market Access • Export Competition • Domestic Support
Market Access • Tiered Approach • High Tariffs Reduced the Most • Tariff Reductions from Bound Rates • Harbinson 2d Draft Likely Starting Point • Designation of Sensitive Products • Special & Differential Treatment for LDCs & Developing Countries • Longer Time Frame, Less Reduction
Export Competition • Reduce & Phase Out Export Subsidies by Date Certain • Export Credit Guarantees > 180 Days • $4.7 Billion/year in Recent Years • t.b.n. Interest Rates, Premiums, Payment • Eliminate Trade Distorting Practices of State Traders, such as Canadian Wheat Board • Subsidies, Govt. Financing, Loss Coverage • Food Aid that Displaces Commercial Sales to Be Eliminated
Domestic Support • Biggest Spenders Take Biggest Cuts • Tiered Formula Using Total AMS • EU ($71 Billion), Japan, US ($49 Billion) • 20% Reduction in Allowable Trade Distorting Support in Year 1 • Amber Box + De Minimis+ Blue Box = $49 Billion • $9.8 Billion Reduction for US • No Impacts on US Farm Program Spending at Current Levels ($23 Billion/Year) • If Prices Fall & Spending Exceeds $39.2 Billion, then Program Impacts
Domestic Support • Blue Box: Direct Payments, Production Limiting Programs or Decoupled Payments • Direct Payments, Fixed Area & Yield Base or 85% of Fixed Base • Create a ‘New’ Category (Shelter CCPs) • Other Changes t.b.n. • Green Box: Minimally Trade Distorting • Criteria Reviewed & Clarified • Ensure Only Minimally Trade Distorting Policies Included • Likely Remain a Shelter for Non-trade Concerns (Multifunctionality, etc.)
Issues • Are More Trade Agreements a Desirable Outcome? • Without Trade Agreements, U.S. Market Access Limited • With Agreements, No Guarantee of Market Growth • Investment & Economic Development Crucial for Central America & Many Other Trading Partners
Conclusions • U.S. Market Much More Open than Others • With Trade Agreements, Tariffs Will Fall, U.S. Access to Foreign Markets Will Increase • Opportunity for Input On Agreements
Thank You!Informed Decisions for Global Change” Center for North American Studies Parr Rosson Ph: 979-845-3070 E-mail: prosson@tamu.edu Http://cnas.tamu.edu Video of WTO & Trade Agreements