General Linear Model & Classical Inference
General Linear Model & Classical Inference. Guillaume Flandin Wellcome Trust Centre for Neuroimaging University College London. SPM M/ EEGCourse London, May 2013. Random Field Theory. Contrast c. Statistical Parametric Maps. mm. time. time. 1D time. mm. frequency. mm.

General Linear Model & Classical Inference
E N D
Presentation Transcript
General Linear Model& Classical Inference Guillaume Flandin Wellcome Trust Centre for Neuroimaging University College London SPM M/EEGCourse London, May 2013
Random Field Theory Contrast c
Statistical Parametric Maps mm time time 1D time mm frequency mm 3D M/EEG sourcereconstruction,fMRI, VBM 2D+t scalp-time mm time 2D time-frequency mm
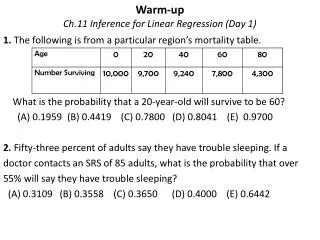
ERP example • Random presentation of ‘faces’ and ‘scrambled faces’ • 70 trials of each type • 128 EEG channels Question: is there a difference between the ERP of ‘faces’ and ‘scrambled faces’?
ERP example: channel B9 Focus on N170 compares size of effect to its error standard deviation
Faces Scrambled X2 Y = b1 • X1 + b2 • + Data modelling Data = b1 + b2 + Error
b1 b2 Y = X • b + Design matrix Parameter vector Error vector Design matrix Data vector = +
General Linear Model X + y = • Model is specified by • Design matrix X • Assumptions about e N: number of scans p: number of regressors The design matrix embodies all available knowledge about experimentally controlled factors and potential confounds.
GLM: a flexible framework for parametric analyses • one sample t-test • two sample t-test • paired t-test • Analysis of Variance (ANOVA) • Analysis of Covariance (ANCoVA) • correlation • linear regression • multiple regression
b1 b2 Parameter estimation Objective: estimate parameters to minimize = + Ordinary least squares estimation (OLS) (assuming i.i.d. error):
Mass-univariate analysis: voxel-wise GLMEvoked response image Sensor tovoxel transform Time Transform datafor all subjectsandconditions SPM: Analyse data at each voxel
Null Distribution of T Hypothesis Testing To test an hypothesis, we construct “test statistics”. • Null Hypothesis H0 Typically what we want to disprove (no effect). The Alternative Hypothesis HA expresses outcome of interest. • Test Statistic T The test statistic summarises evidence about H0. Typically, test statistic is small in magnitude when the hypothesis H0 is true and large when false. We need to know the distribution of T under the null hypothesis.
Hypothesis Testing u • Significance level α: Acceptable false positive rate α. threshold uα Threshold uα controls the false positive rate Null Distribution of T • Conclusion about the hypothesis: We reject the null hypothesis in favour of the alternative hypothesis if t > uα t • p-value: A p-value summarises evidence against H0. This is the chance of observing value more extreme than t under the null hypothesis. p-value Null Distribution of T
SPM-t over time & space cT = -1 +1 contrast ofestimatedparameters t = varianceestimate Contrast & t-test Contrast : specifies linear combination of parameter vector: ERP: faces< scrambled ? = Test H0:
Alternative hypothesis: H0: vs HA: T-test:summary • T-test is a signal-to-noise measure (ratio of estimate to standard deviation of estimate). • T-contrasts are simple combinations of the betas; the T-statistic does not depend on the scaling of the regressors or the scaling of the contrast.
X0 X0 X1 RSS0 RSS Or reduced model? Extra-sum-of-squares & F-test Model comparison: Full vs. Reduced model? Null Hypothesis H0:True model is X0 (reduced model) Test statistic: ratio of explained and unexplained variability (error) 1 = rank(X) – rank(X0) 2 = N – rank(X) Full model ?
Tests multiple linear hypotheses: test H0 : cTb = 0 ? H0: b3 = b4 = 0 0 0 1 0 0 0 0 1 cT = F-test& multidimensional contrasts H0: True model isX0 X0 X1 (b3-4) X0 Full or reduced model?
F-test:summary • F-tests can be viewed as testing for the additional variance explained by a larger model wrt a simpler (nested) model model comparison. • F tests a weighted sum of squares of one or several combinations of the regression coefficients b. • In practice, we don’t have to explicitly separate X into [X1X2] thanks to multidimensional contrasts. • Hypotheses: • In testing uni-dimensional contrast with an F-test, for example b1 – b2, the result will be the same as testing b2 – b1. It will be exactly the square of the t-test, testing for both positive and negative effects.
Orthogonal regressors Variability described by Variability described by Testing for Testing for Variability in Y
Correlated regressors Shared variance Variability described by Variability described by Variability in Y
Correlated regressors Testing for Variability described by Variability described by Variability in Y
Correlated regressors Testing for Variability described by Variability described by Variability in Y
Correlated regressors Variability described by Variability described by Variability in Y
Correlated regressors Testing for Variability described by Variability described by Variability in Y
Correlated regressors Testing for Variability described by Variability described by Variability in Y
Correlated regressors Testing for and/or Variability described by Variability described by Variability in Y
Summary • Mass-univariate GLM: • Fit GLMs with design matrix, X, to data at different points in space to estimate local effect sizes, • GLM is a very general approach(one-sample, two-sample, paired t-tests, ANCOVAs, …) • Hypothesis testing framework • Contrasts • t-tests • F-tests
Multiple covariance components enhanced noise model at voxel i error covariance components Q and hyperparameters Q1 Q2 V 1 + 2 = Estimation of hyperparameters with ReML (Restricted Maximum Likelihood).
Weighted Least Squares (WLS) Let Then WLS equivalent to OLS on whitened data and design where
Modelling the measured data Make inferences about effects of interest Why? • Decompose data into effects and error • Form statistic using estimates of effects and error How? stimulus function effects estimate linear model statistic data error estimate