Grinols and Mustard
170 likes | 320 Vues
Grinols and Mustard. Impact of a casino opening on crime rates Concern: casinos are not random – opened in struggling areas Data at county/year level – simple dummy that equals 1 in year of intervention, =0 otherwise. Dranove et al. . Introduction.

Grinols and Mustard
E N D
Presentation Transcript
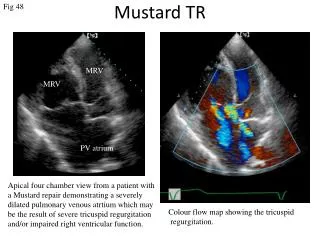
Grinols and Mustard • Impact of a casino opening on crime rates • Concern: casinos are not random – opened in struggling areas • Data at county/year level – simple dummy that equals 1 in year of intervention, =0 otherwise
Introduction • Increased use of report cards, especially in health care and education • Two best examples: • NCLB legislation for education • NY’s publication of coronary artery bypass graft (CABG) mortality rates for surgeons and hospitals
Disagreement about usefulness • For: Better informed consumers make better decisions, makes markets more efficient • Choose best doctors • Provides incentives for schools and doc’s to improve care • Against • May give incomplete evidence. Can risk adjust but not on all characteristics • Doc’s can manipulate rankings by selecting patients with the highest expected success rate, decreasing access to care for the sickest patients
This paper • Uses data on al heart attack patients in Medicare in from 1987-94 • Impact of reports cards in NY and PA • Examines three sets of outcomes associated with report cards • Matching of patients to providers: is there a match of the sickest patients to best providers? • Incidence and quantity of CABG • Do total surgeries go up or down? • Shift to healthier patients? • Is there a substitution into other forms of treatment NOT measured by the report card?
Report Cards • NY • Hospital specific, risk adjusted CABG mortality rates based on 1990 • Physician specific rates in 1992 • PA – hospital specific data in 1992 • Effective dates – impact patient decision making in 1991 (NY) and 1993 (PA) concerning hospitals, 1993 in both states for physicians
Data • Population potentially impacted are those with acute myocardial infarctions (AMI) in Medicare • Easily obtained from Medicare claims data • Large fraction treated with CABG • Selection into the sample unlikely impacted by report cards • Physicians treating AMI likely to have multiple treatment options (e.g., heart cath., medical treatment, etc.)