Download
1 / 20
200 likes | 362 Vues
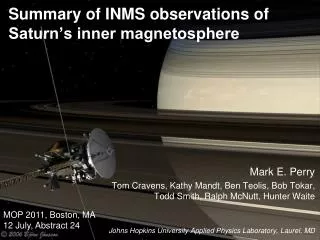
Summary of INMS observations of Saturn’s inner magnetosphere. Mark E. Perry Tom Cravens, Kathy Mandt, Ben Teolis, Bob Tokar, Todd Smith, Ralph McNutt, Hunter Waite Johns Hopkins University Applied Physics Laboratory, Laurel, MD. MOP 2011, Boston, MA 12 July, Abstract 24.

E N D
Summary of INMS observations of Saturn’s inner magnetosphere Mark E. Perry Tom Cravens, Kathy Mandt, Ben Teolis, Bob Tokar, Todd Smith, Ralph McNutt, Hunter Waite Johns Hopkins University Applied Physics Laboratory, Laurel, MD MOP 2011, Boston, MA 12 July, Abstract 24
Understanding Saturn’s inner magnetosphere: INMS neutrals • INMS provides in-situ measurements • Due to radiation and sensitivity constraints, observations are between 3.9 and 6.5 RS from Saturn and within 0.5 RS of the equatorial plane. • Mostly measure H2Obut CO2 and dustalso observed • OH, O, not possible • INMS neutral measurements are beginning to provide radial, azimuthal, and Z distributions • Through models, distributions are sensitive probes of the source, transport, and loss mechanisms that define the neutrals and ions that populate the inner magnetosphere Neutral distribution, Jurac and Richardson, 2005 MOP 2011
Understanding Saturn’s inner magnetosphere: INMS ions • INMS can supplement CAPS survey • Unambiguous separation of water-group ions • Single-pass temporal and spatial resolution (0.2 RS) • Use CAPS phase-space distribution to interpret INMS data, which cover only a small portion of the velocity PSD • Measurement goals: • Water-group ion distribution as a function of • RS, Z, theta • Phase-spacevelocity • Time • High-resolutionion density MOP 2011
Early results of INMS IM neutral observations • Includes INMS measurements before close approach on E3 and E5 • Within uncertainties, no difference between E3 and E5 • Compare results to Smith’s model of neutral distribution • Neutral cloud distribution depends on transport and loss All observations during highly-inclined trajectories MOP 2011
Neutral density vs. distance from Saturn • Preliminary result: relative density, only • Data from rev 128: CDA observation in equatorial plane. • About 120 degrees from Enceladus • These are inbound data; also have outbound • May be able to evaluate composition dependence on distance, also MOP 2011
E3 and E5 densities south of Enceladus • Farther than 500 km from the surface (2 Re from the surface or 750 km from Z=0), E3 and E5 densities are identical. • Difference when closer to Enceladus due to path through plume E5 was 7 months after E3 Location of E8 data MOP 2011
Densities vary at Z= -1,832 km • E3 and E5 densities are identical to each other and are 3 times higher than peak E8 CSN densities • Temporal difference, or due to jets? Ions 1,000 km E5 E3 E8 Projection of Enceladus onto plane Y distance in Enceladus frame (km) OSNB detection; Peak CSN density Sharp drop in neutral density Saturn X distance (Saturn direction) in Enceladus-centered frame (km) MOP 2011
Dust and INMS: byproduct and error source H2O only seen for some orientations • Each spike caused by an ice grain • Identified by large increase in a single measurement. • Measurements separated by fractions of a second • Equatorial pass near 4 RS. • Dividing number of spikes by the duty cycle indicates density H2 measurements during rev 128 MOP 2011
Interpreting INMS phase space densities • INMS measures only a small portion of velocity phase space • Use results of CAPS surveys to put INMS results in context • Vperp = perpendicular to the magnetic field (Vperp is in XY plane) • Vpar= parallel to the magnetic field (aligned with Saturn’s axis of rotation) • Ions are dispersed in velocity phase space • INMS measures ions regardless of Cassini pointing • Signal-to-noise is best when INMS points in XY plane, and between 4-6 RS. 4.5 Rs 5.5 Rs Tokar, et al., 2008 MOP 2011
INMS phase-space densities for water-group ions Rev 122 • INMS measures only a small area of velocity phase space • Decline in count rate is due to increasing distance from Saturn and due to reduction in pick-up ions • H+, H2+, and N+are below the noise level • May be some H3O+ observed, but it is at the noise level • Error bars show 1σ statistical uncertainty All data were obtained within 1,300 km (0.02 RS) of the equatorial plane Total water-group velocity phase-space density: all ions, all velocities measured by INMS CAPS PSD, for all velocities in the equatorial plane for v=20 km/s ions MOP 2011
Ion density extended to 4RS • Total water-group density measured to 4 Rs • Preliminary, relative densities • Linear trend continues Dip caused by change in pointing MOP 2011
Fractional distribution of ions with the water group for Rev 122 • These data are binned heavily to reduce statistical variations. • O+ is a relatively-flat proportion of the total water group • H2O+ drops below OH+ at the farthest measurement from Saturn at 5.5 RS. • The error bars show the statistical uncertainty. • H3O+ signal is 0.1 of H2O+, but uncertainty is 100% MOP 2011
Models of relative abundances,Smith et al., JGR 2010 • Ion distributions depend on • Local neutral distributions • Transport to/from other portions of the magnetosphere • Loss mechanisms • Distribution of water-group ions is similar to neutral density at from 4-5 RS (Smith model) • INMS measures ions in transition from high-to-low H2O+ • Closer to 4 RS, H2O+ dominates • Farther out, H2O+ is much lower density MOP 2011
Extend water fractions to 4.0 RS • Water-group ions are nearly 100% H2O+ at 4.0 RS • Fractions at 5 RS agree with previous results • Is there a dependence on phase space? MOP 2011
Rev 127: pointing varies in and out of equatorial plane • Thick line is Vperp vs time • Expect ions density to fall off above 30 km/s • Dashed line is VPAR (normal to XY plane) • Expect distribution to fall off above 15 km/s (more rapidly than Vperp) • Thin line is water ion density (mass 18) vs. time (hrs) • Higher count rate when VPAR <10 km/s and VPERP <25 km/s Outbound Inbound 4 Rs 4 Rs MOP 2011
INMS observations in velocity phase space • During rev 127, the location of measurements in phase space varies between low and high Vpar • Can directly compare distribution within the water group in both locations Low counts Higher counts MOP 2011
Summary • Neutrals: Beginning to measure distribution • Consistent with models; initial azimuthal distribution • Ions: Phase-space densities consistent with CAPS • Co-rotating thermalized ions enhanced by pickup-ions closer to 4 RS. Density dependence on VPAR. • Ions: have distribution among the water-group ions (H2O+, OH+, and O+); expanding spatial and velocity coverage. • See a region rich in H2O+ near 4 RS and a region with relatively more OH+ near 5.5 RS. • Plans for future measurements between 3.5 and 6 RS. • Improved accuracy, resolution (better observ parameters) • The distribution of species within the water-group ions vs. location in physical space and in velocity phase space • Measures of azimuthal and radial neutral densities • Investigate potential composition dependencies MOP 2011
Additional information MOP 2011
Limitations of INMS ion measurements • INMS measures only a tiny portion of velocity phase space at a time • Small FOV: 2-degree radius • Single velocity: ΔV=<10% • Sensitivity insufficient to measure ions beyond 6 RS. • Maximum velocity with respect to Cassini is 22 km/s • Bulk velocity of ions is close to co-rotation velocity, which is >40 km/s at 5 RS and increases outward • Measure one mass and one velocity at a time. • Since ions are broadly distributed in phase space, not too limiting. Persoon et al., 2009 MOP 2011
INMS mass spectra: Rev 122Count rate for each ion mass vs. time • Water group ions measured between 10:10 UTC and 12:40 UTC, when the INMS aperture pointing is advantageous for measuring ions co-rotating with Saturn’s magnetic field. Red= high count rate • The periodicity in the water-group data is due to velocity scanning and INMS sensitivity, which is much greater at higher velocities • Only the higher velocities have count rates above background. Count rates uniformly higher when binning data on board Count rates are higher when INMS measures higher velocities Water-group (masses 16-18) H2O+, OH+, O+ Black= low count rate 5.8 RS 4.5 RS MOP 2011