Download
1 / 1
10 likes | 123 Vues
Flare Energy Build-Up in a Decaying Active Region Near a Coronal Hole. Yingna Su 1,2 , Adriaan van Ballegooijen 1 , Brigitte Schmieder 3 , Arkadiusz Berlicki 3 , Yang Guo 3 ,Leon Golub 1 , Guangli Huang 2.

E N D
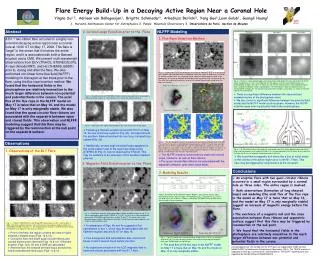
Flare Energy Build-Up in a Decaying Active Region Near a Coronal Hole Yingna Su1,2, Adriaan van Ballegooijen1, Brigitte Schmieder3, Arkadiusz Berlicki3, Yang Guo3,Leon Golub1, Guangli Huang2 • Harvard-Smithsonian Center for Astrophysics 2. Purple Mountain Observatory 3. Observatoire de Paris, Section de Meudon Abstract NLFFF Modeling 2. Coronal Loops Evolution prior to the Flare 1. Flux Rope Insertion Method A B1.7 two-ribbon flare occurred in a highly non-potential decaying active region near a coronal hole at 10:00 UT on May 17, 2008. This flare is “large” in the sense that it involves the entire region, and it is associated with both a filament eruption and a CME. We present multi-wavelength observations from EUV (TRACE, STEREO/EUVI), X-rays (Hinode/XRT), and Hα (THEMIS, BBSO) prior to, during and after the flare. We also performed non-linear force free field (NLFFF) modeling for the region at two times prior to the flare, using the flux rope insertion method. We found that the horizontal fields in the photosphere are relatively insensitive to the much larger difference between non-potential and potential fields in the corona. The axial flux of the flux rope in the NLFFF model on May 17 is twice that on May 16, and the model on May 17 is only marginally stable. We also found that the quasi-circular flare ribbons are associated with the separatrix between open and closed fields. This observation and NLFFF modeling suggest that this flare may be triggered by the reconnection at the null point on the separatrix surface. Fig. 5.— (a) Magnetic map of the decaying active region on 2008 May 16 at 11:42 UT derived from THEMIS and SOHO/MDI data. (b) Magnetic map of the region on 2008 May 17 at 08:03 UT derived from MDI data. The grayscale image shows the radial magnetic field Br in the photosphere as function of longitude and latitude on the Sun (white for Br >0, black for Br <0). The white lines ending with two circles refer to the selected filament paths along which flux ropes are inserted. Fig. 8.— Vectors in small zoomed regions from the potential field model (first row) and the best-fit NLFFF model (second row) at 11:42 UT on 2008 May 16. The regions in the first and second columns are corresponding to regions S2 and S1 in Figure 5a. The first and second columns show modeled (white or black ) and observed (blue) vectors at photosphere. The third columns show the modeled vectors at chromosphere for region S1. The maximum horizontal field strength in unit of Gauss is shown at the lower right corner of each panel. • There is a significant difference between the observed and modeled vectors at the photospheric level. • We also found no significant difference between the potential field model and the NLFFF model at photosphere. However, the NLFFF is farther away from the potential field at the chromosphere. Fig. 2.— Hα (left column) and TRACE/EUV (right column) observations prior to and after a filament eruption on May 16. The white box in (c) refer to the field of view of (a). Fig. 3.— Formation of the highly sheared loops in the south eastern part of the region. • Following a filament eruption around 20:15 UT on May 16, the two short loop systems (Fig. 2b) corresponding to the southern filament evolved into one long J-shaped loop system (Fig. 2d). • Additionally, several bright sheared loops appeared in the south-eastern part of the region as observed by STEREO-B (Fig. 3), but not observed by TRACE. This may be evidence of an extension of the southern filament channel. Observations Fig. 6. — The red and green contours refer to positive and negative magnetic fields from MDI. The red lines in (a) refer to selected coronal loops observe by XRT. The pink, blue, and light blue lines are the best-fit model field lines. Dips of model field lines (yellow) are shown in (b). Quasi Separatrix Layer (QSL) maps at height of 1 Mm for two different models are shown in (c) and (d). The open field region is indicated in yellow, while the field lines in the blue area are closed. The white layers are the quasi separatrix layers. Fig. 9.— (a) Selected field lines (from model 3) showing the separatrix surface between open and closed fields, and the magnetic null at height of 25 Mm. It is a 3D plot projected on the 2D plane. (b) A cartoon that illustrates the 2D view of magnetic configuration prior to the flare. 1. Observations of the B1.7 Flare • The NLFFF model is constrained by observed coronal loops, filaments, as well as flare ribbons. • The quasi-circular flare ribbons are associated with the separatrix between open and closed fields. • We found that a magnetic null (more like a line of nulls) exists in the corona of the active region prior to the B1.7 flare. This flare may be triggered by reconnection at the null point. 3. Magnetic Field Evolution prior to the Flare Conclusions 2. Modeling Results • An eruptive flare with two quasi-circular ribbons occurred in a small region surrounded by a coronal hole on three sides. The entire region is involved. • Both observations (formation of long sheared loops) and modeling (the axial flux of the flux rope in the model on May 17 is twice that on May 16, and the model on May 17 is only marginally stable) suggest an increase of magnetic energy before the flare. • The existence of a magnetic null and the close association between flare ribbons and separatrix surface suggest that this flare may be triggered by reconnection at the null point. • We found that the horizontal fields in the photosphere are relatively insensitive to the much larger difference between non-potential and potential fields in the corona. Table 1. Parameters for three NLFFF models. Models 1 and 2 contain two flux ropes, and model 3 contains three flux ropes. The poloidal flux (Fpol) and axial flux (ϕaxi) of the flux rope are in units of Mx cm−1 and Mx, respectively. The upper limit of the axial flux of the flux ropes is given in brackets. Fig. 4.— Evolution of magnetic fields observed by THEMIS and MDI on May 16 and 17. (a) Vector magnetogram observed by THEMIS at 11:42 UT. (b)–(d) Line of sight magnetogram observed by SOHO/MDI at different times on May 16 and 17. The vectors refer to the observed vectors without 180-ambiguity resolution. The positive and negative polarities are shown as white and black spots. Fig. 1.— TRACE, STEREO/EUVI, and Hinode/XRT observations of a B1.7 flare on May 17, 2008. The white and black contours refer to the positive and negative magnetic fields from SOHO/MDI at 08:03 UT on May 17. The erupted filament material is marked with white arrows. Dashed line in (a) represents the locus of a filament. • A comparison of Figs. 4b and 4c suggests a flux cancellation in box 1, which may be associated with the filament eruption around 20 UT on May 16. • Flux emergence and cancellations also occurred in boxes 2 and 3 several hours before the flare. • No significant evolution of the LOS magnetic field is observed closely associated with the B1.7 flare. • Prior to the flare, the region contains two sets of highly sheared J-shaped loops (Figs. 1a & 1d). • During the flare, two bright quasi-circular ribbons and coronal dimming are observed (Figs. 1b & 1e). A filament eruption (Figs. 1g & 1h) and a CME are associated. • After the flare, the sheared pre-flare loops evolved into nearly potential post-flare loops (Figs. 1c & 1f) . Fig. 7. — NLFFF models with selected field lines on May 16 at 11:42 UT (a) and May 17 at 08:03 UT (b). The red and green contours refer to positive and negative magnetic fields from THEMIS+MDI (a) and MDI (b). • The axial flux of the flux rope in the NLFFF model on May 17 is twice that on May 16, and the model on May 17 is only marginally stable. Acknowledgements: US members of the XRT team are supported by NASA contract NNM07AA02C to Smithsonian Astrophysical Observatory (SAO). The TRACE analysis is supported at SAO by a contract from Lockheed Martin. The NLFFF modeling work was supported by NASA/LWS grant NNG05GK32G.