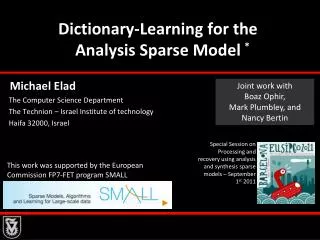
Sparse Factor Analysis for Learning Analytics
Learn about SPARse Factor Analysis (SPARFA) model for personalized learning, joint assessment of students and content, automated feedback, and statistical modeling to enhance learning analytics efficiency.


Sparse Factor Analysis for Learning Analytics
E N D
Presentation Transcript
Sparse Factor Analysis for Learning Analytics Andrew Waters, Andrew Lan, Christoph Studer, Richard Baraniuk Rice University
Learning Challenges Poor access to high-quality materials ($) One-size-fits-all Inefficient, Slow feedback unpersonalizedcycle
Personalized Learning Adaptation • to each student’s background, context, abilities, goals Closed-loop • tools for instructors and students to monitor and track their progress Cognitively informed • leverage latest findings from the science of learning Automated • Do this automatically data Data(massive, rich, personal)
Jointly Assess Students and Content • Latent factor decomposition (K concepts): • Which concepts interact with which questions • How important is each concept for each question • Which questions are easy / difficult • How well have students mastered each concept • Do this solely from binary Q/A (possibly incomplete) data
Statistical Model Partially observed data Inverse link function (probit/logit) Intrinsic difficultyof Question i Concept mastery of Student j Concept weight for Question i
Model Assumptions Model is grossly undetermined We make some reasonable assumptions to make it tractable: - low-dimensionality - questions depend on few concepts - non-negativity • SPARse Factor Analysis (SPARFA) model • We develop two algorithms to fit the SPARFA model to data
SPARFA-M: Convex Optimization Maximize log-likelihood function • Use alternate optimization with FISTA [Beck & Teboulle ‘09] for each subproblem • Bi-convex: SPARFA-M provably converges to local minimum
SPARFA-B: Bayesian Latent Model Use MCMC to sample posteriors Efficient Gibbs’ Sampling Assume probit link function C μ Z Y W Sparsity Priors: Key Posteriors:
Ex: Math Test on Mechanical Turk High School Level 34 questions100 students SPARFA-Mw/ 5 concepts Visualize W, μ
Tag Analysis Goal: Improve concept interpretability Link tags to concepts C1 T1 T2 C2 . . . . . . CK TM
Algebra Test (Mechanical Turk) 34 questions, 100 students Concepts decomposed into relevant tags
Synthetic Experiments Generate synthetic Q/A data, recover latent factors Performance Metrics: Compare SPARFA-M, SPARFA-B, and non-negative variant of K-SVD
Ex: Rice University Final Exam Signal processing course 44 questions15 students 100% observed data SPARFA-M, K=5 concepts
Student Profile Student Profile: Student’s understanding of each Tag Average Student Profile on Rice Final Exam Student 1 Profile on Rice Final Exam SPARFA automatically decides which tags require remediation
STEMscopes 8th grade Earth Science 80 questions145 students SPARFA-B: K=5 Concepts Highly incomplete data: only 13.5% observed
STEMscopes – Posterior Stats Randomly selected students Single concept (Energy Generation) Student 7 and 28 seem similar: S7: 15/20 correct S28: 16/20 correct Very different posterior variance: Student 7: Mix of easy/hard questions Student 28: Only easy questions – cannot determine ability
Conclusions • SPARFA model + algorithms fit structural model to student question/answer data • Concept mastery profile • Relations of questions to concepts • Intrinsic difficulty of questions SPARFA can be used to make automated feedback / learning decisions at large scale