
Optimal Hybridization Temperature in Maize Microarray Analysis
This study investigates the effect of hybridization temperature on maize microarray signal variance and non-specific hybridization. The research identifies an optimal temperature of 55°C for hybridizing maize oligonucleotide microarrays to minimize false positives and negatives during gene expression analysis. The methodology includes RNA extraction from varying tissue types and detailed hybridization procedures. Results assert the importance of temperature in accurate gene detection, providing valuable insights for genetic research in maize.

Optimal Hybridization Temperature in Maize Microarray Analysis
E N D
Presentation Transcript
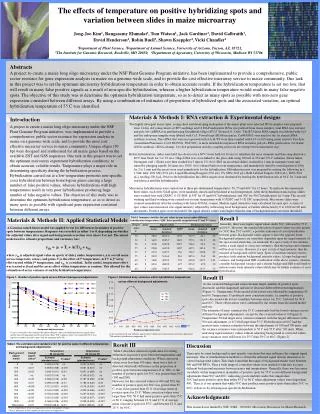
Figure 2. Estimated array variances within hybridization temperatures across different background adjustments No. positive spots Array variance Signal values Background adjustment value Background adjustment value In the last point on X axis indicates signal values without any background or correction adjustment. T50 indicates hybridization temperature 50. The effects of temperature on positive hybridizing spots and variation between slides in maize microarray Jong-Joo Kim1, Rangasamy Elumalai1, Tom Watson1, Jack Gardiner1, David Galbraith1, David Henderson2, Robin Buell3, Shawn Kaeppler4, Vicki Chandler1 1Department of Plant Science, 2Department of Animal Science, University of Arizona, Tucson, AZ, 85721, 3The Institute for Genomic Research, Rockville, MD 20850, 4Department of Agronomy, University of Wisconsin, Madison WI 53706 Abstracts A project to create a maize long oligo microarray under the NSF Plant Genome Program initiative, has been implemented to provide a comprehensive, public sector resource for gene expression analysis in maize on a genome-wide scale, and to provide the cost effective micrarray service to maize community. One task in this project was to set the optimum microarray hybridization temperature in order to obtain accurate results. If the hybridization temperature is set too low, that will result in many false positive signals as a result of non-specific hybridization, whereas a higher hybridization temperature would result in many false negative spots. The objective of this study was to determine the optimum hybridization temperature, so as to detect as many spots as possible with non-zero gene expression consistent between different arrays. By using a combination of estimates of proportions of hybridized spots and the associated variation, an optimal hybridization temperature of 55 C was identified. Introduction Materials & Methods I: RNA extraction & Experimental designs Two highly divergent tissue types, young shoot and developing endosperm of the maize plant were selected. RNA samples were prepared from 14 day old young shoots of B73 seedlings and 14 DAP endosperm. RNA was purified from tissue samples, total RNA was isolated and poly(A+) mRNA was purified using DynaBeads Oligo (dT)25 (Dynal A.S., Oslo). The B73 shoot RNA sample was labeled with Cy5 and the endopserm samples were labeled with Cy3. PowerScript (BD Biosciences; Cat#639501) was used for the 1st strand cDNA synthesis reaction. The cDNA that were incorporated with AA-dUTP were then coupled with Cy3 or Cy5 using mono reactive Cye dyes (Amersham Pharmacia; Cat # PA23001, PA25001). A more detailed description of RNA isolation, polyA+ RNA purification, 1st strand cDNA synthesis, cDNA cleanup, Cye dye preparation and dye coupling protocols are at http://www.maizearray.org/. Before hybridization, slides were held face down over a 60°C water bath for 10 secs to rehydrate the array elements and then snap dried on a 80°C heat block for 3 to 10 secs. Oligo DNA was cross-linked to the glass slide using 180 mJ of 254-nm UV-C radiation (Strata linker, Stratagene cat# ). Slides were then washed for 5 min in 1% (w/v) SDS on an orbital shaker, washed for 1 min in nanopure water and rinsed by plunging rapidly 20 times in a 100% (w/v) ethanol bath at room temperature, and immediately dried by centrifugation at 200g for 2 to 5 min and the arrays were used immediately for the hybridization. Hybridization mix was prepared by mixing the following in a 1.5mL tube: 20X SSC(25.0 μL), Liquid Blocking Reagent (15.0 μL), 2% SDS (10.0 μL), Both Labeled Targets (160.0 μL), H2O (50.0 μL), totaling 250.0 μL. Prior to the hybridization the cDNA targets were denatured by heating the hybridization mix at 94 C for 2 min and stored in ice until the hybridization. Microarray hybridizations were carried out at three pre-determined temperatures: 50, 55 and 60 C for 12 hours. To replicate the experiment three slides, each with 32448 spots, were randomly chosen and hybridized at each temperature. After the hybridization microarray slides were washed first with 2XSSC, 0.1% SDS, at 55C for 55 and 60 C hybridizations, and 50C for 50 C hybridization for 5 min. The second washing and third washing were carried out at room temperature with 0.5XSSC and 0.1X SSC respectively. Microarray slides were scanned immediately after the washing with Axon 4100AL scanner. Median signal intensities were calculated for each spot. A series of spot values were measured; raw signal intensity, adjusted by subtracting local background, or further subtraction by 0 to 1000 in 100 unit increments. Positive spots were declared if the signal density values were higher than the sum of background and correction threshold. A project to create a maize long oligo microarray under the NSF Plant Genome Program initiative, was implemented to provide a comprehensive, public sector resource for expression analysis in maize on a genome-wide scale, and to provide the most cost effective micrarray service to maize community. Unique oligos (70 bp) were designed and synthesized for all maize genes based on the available EST and GSS sequences. One task in this project was to set the optimum microarray experiment hybridization conditions, to obtain accurate, reliable results. Temperature plays a major role in determining specificity during the hybridization process. Hybridization carried out at a low temperature promotes non-specific cross hybridization between homologous genes causing a large number of false positive values, whereas hybridizations with high temperatures result in very poor hybridization producing large number of false negative values. The objective of this study was to determine the optimum hybridization temperature, so as to detect as many spots as possible with significant gene expression consistent between different arrays. Materials & Methods II: Applied Statistical Models Table1. Summary statistics for spot values in nine arrays under different hybridization temperatures. IQR: Inter quantile range between 1st and 3rd values Result I Generally, there were higher signal values under 50 C, followed by 55 C and 60 C. However, the standard deviation of signal values was also greater for 50 C than 55 C or 60 C, a possible indication of cross hybridization between genes. Background values appear to have the opposite trend. Background estimates are somewhat dependent upon the signal intensity of the spot around which they are estimated. If a spot is truly of low intensity (either a weak signal or a true zero estimate), then the background estimates will be close to zero. However, if a spot is truly of high intensity, then the estimate of background will be large. Spots of moderate intensity tend to produce fairly random background intensity values. A larger background variance, and background IQR, is indication of the above scenario, whereas a smaller background variance and a shorter background IQR would tend to indicate many weak intensity values which may be further evidence of cross hybridization. A Gaussian mixed linear model was applied to test for differences in number of positive spots between temperatures. Response was recorded as either 1 or 0, depending on whether the adjusted values after signal and background correction were above 0 or not. The mixed model used to estimate proportions and variances was: yijk = µ + Ti + A(T)ij + eijk where yijk is adjusted signal value on spot k of slide j under temperature i, µ is overall mean across temperates, arrays, and genes, Ti is the effect of ith temperature, A(T)ij is jth array effect nested within ith temperature, and eijk is a residual. In the model, temperature effect was treated as fixed and the array effect within temperature as random. This allowed for the estimation of array variance at each hybridization temperature. Result II Figure 1. Number of positive spots across different background adjustments As the corrected background values became larger, number of positive spots decreased, and the magnitude and rate of decrease differed between temperatures (Figure 1). Temperature 50 decreased at the lowest rate followed by temperature 55 and 60. Temperature 55 produced most consistent results, i.e. number of positive spots decreased with lowest variability between arrays for 55 C, followed by 50 C and 60 C. These observations were confirmed by the results from the mixed model analysis. The estimates of array variances for 55 C consistently had the lowest variance across different background adjustments, except for the corrected value of 0 (Figure 2). Temperature 50 had larger array variance estimates with the largest difference at the 500 unit adjustment, or 6.3 fold larger than 55 C. Hybridization at 60 C had the greatest array variance estimates between the adjustments of 100 and 500 units, and the variance estimates were intermediate to 50 C and 55 C after 700 units. When analyzing signal intensity values without adjusting background or corrected values, array variances were still lower for 55 C than 50 C or 60 C (Figure 2). X axis is correction value such that the adjusted density value is the difference between signal values and the sum of background and the correction values. T50.1 indicates array 1 in temperature 50. Y axis represents number of positive spots with the maximum of 32448. Table2. The estimates (and standard error) for positive spots in different temperatures and background adjustments Result III Discussion Table 2 describes statistical significance for testing differences in positive spots between temperatures and background adjustment conditions. When correction values were less than 500 units, there was a lack of detected statistically difference in the proportion of positive spots between temperatures (0 or 300), or the number of positive spots for 55 C was greater than 50 C (100 and 200). However, for the corrected values of 400 and 500, the number of positive spots for 50 C was greater than 55 C, even if not greater than 10 % of average mean of positive spots for 55 C. When correction values were larger than 500, 50 C had more positive spots than 55 C or 60 C, ranging between 12 % and 17 % of average mean of positive spots for 55 C, and between 22 % and 24 % for 60 C. There may be some background or spot specific variations that may influence the original signal measures. One of standardization methods to obtain the unbiased signal density measures is to control background values. This study found that the range of background means were between 400 and 900 RFUs. Thus a wide range of correction values were applied to take into account different background measures between arrays and temperatures. Generally, there was less array variability within temperatures in number of positive spots for 55 C across different background adjustments than 50 C and 60 C, indicating good reliability under this temperature. 50 C had more positive spots than either 55 C or 60 C when adjustment values were larger than 400. Thus, it is our opinion that while 50 C may produce more positive spots than either 55 C or 60 C, it does so by allowing non-specific hybridization. Acknowledgments This research was funded by NSF / DBI – 0321663, Microarray Resources for Maize Research. aF test of differences between temperatures for the total number of spots. bTest of difference in total number of spots between temperatures.


