Workload Characterization Techniques
Workload Characterization Techniques. Raj Jain Washington University in Saint Louis Saint Louis, MO 63130 Jain@cse.wustl.edu These slides are available on-line at: http://www.cse.wustl.edu/~jain/cse567-08/. Overview. Terminology Components and Parameter Selection


Workload Characterization Techniques
E N D
Presentation Transcript
Workload Characterization Techniques Raj Jain Washington University in Saint LouisSaint Louis, MO 63130Jain@cse.wustl.edu These slides are available on-line at: http://www.cse.wustl.edu/~jain/cse567-08/
Overview • Terminology • Components and Parameter Selection • Workload Characterization Techniques: Averaging, Single Parameter Histograms, Multi-parameter Histograms, Principal Component Analysis, Markov Models, Clustering • Clustering Method: Minimum Spanning Tree, Nearest Centroid • Problems with Clustering
Terminology • User = Entity that makes the service request • Workload components: • Applications • Sites • User Sessions • Workload parameters or Workload features: Measured quantities, service requests, or resource demands.For example: transaction types, instructions, packet sizes, source-destinations of a packet, and page reference pattern.
Components and Parameter Selection • The workload component should be at the SUT interface. • Each component should represent as homogeneous a group as possible. Combining very different users into a site workload may not be meaningful. • Domain of the control affects the component: Example: mail system designer are more interested in determining a typical mail session than a typical user session. • Do not use parameters that depend upon the system, e.g., the elapsed time, CPU time.
Components (Cont) • Characteristics of service requests: • Arrival Time • Type of request or the resource demanded • Duration of the request • Quantity of the resource demanded, for example, pages of memory • Exclude those parameters that have little impact.
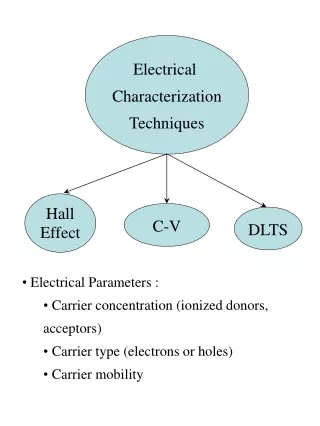
Workload Characterization Techniques • Averaging • Single-Parameter Histograms • Multi-parameter Histograms • Principal Component Analysis • Markov Models • Clustering
Averaging • Mean • Standard deviation: • Coefficient Of Variation: • Mode (for categorical variables): Most frequent value • Median: 50-percentile
Case Study: Program Usage in Educational Environments • High Coefficient of Variation
Characteristics of an Average Editing Session • Reasonable variation
Single Parameter Histograms • n buckets £m parameters £k components values. • Use only if the variance is high. • Ignores correlation among parameters.
Multi-parameter Histograms • Difficult to plot joint histograms for more than two parameters.
Principal Component Analysis • Key Idea: Use a weighted sum of parameters to classify the components. • Let xij denote the ith parameter for jth component. yj = åi=1n wi xij • Principal component analysis assigns weights wi's such that yj's provide the maximum discrimination among the components. • The quantity yj is called the principal factor. • The factors are ordered. First factor explains the highest percentage of the variance.
Principal Component Analysis (Cont) • Statistically: • The y's are linear combinations of x's: yi = åj=1n aij xj Here, aij is called the loading of variable xj on factor yi. • The y's form an orthogonal set, that is, their inner product is zero: <yi, yj> = åk aikakj = 0 This is equivalent to stating that yi's are uncorrelated to each other. • The y's form an ordered set such that y1 explains the highest percentage of the variance in resource demands.
Finding Principal Factors • Find the correlation matrix. • Find the eigen values of the matrix and sort them in the order of decreasing magnitude. • Find corresponding eigen vectors. These give the required loadings.
Principal Component Example • Compute the mean and standard deviations of the variables:
Principal Component (Cont) • Similarly:
Principal Component (Cont) • Normalize the variables to zero mean and unit standard deviation. The normalized values xs0 and xr0 are given by:
Principal Component (Cont) • Compute the correlation among the variables: • Prepare the correlation matrix:
Principal Component (Cont) • Compute the eigen values of the correlation matrix: By solving the characteristic equation: • The eigen values are 1.916 and 0.084.
Principal Component (Cont) • Compute the eigen vectors of the correlation matrix. The eigen vectors q1 corresponding to l1=1.916 are defined by the following relationship: {C}{q}1 = l1 {q}1 or: or: q11=q21
Principal Component (Cont) • Restricting the length of the eigen vectors to one: • Obtain principal factors by multiplying the eigen vectors by the normalized vectors: • Compute the values of the principal factors. • Compute the sum and sum of squares of the principal factors.
Principal Component (Cont) • The sum must be zero. • The sum of squares give the percentage of variation explained.
Principal Component (Cont) • The first factor explains 32.565/(32.565+1.435) or 95.7% of the variation. • The second factor explains only 4.3% of the variation and can, thus, be ignored.
Markov Models • Markov ) the next request depends only on the last request • Described by a transition matrix: • Transition matrices can be used also for application transitions. E.g., P(Link|Compile) • Used to specify page-reference locality. P(Reference module i | Referenced module j)
Transition Probability • Given the same relative frequency of requests of different types, it is possible to realize the frequency with several different transition matrices. • If order is important, measure the transition probabilities directly on the real system. • Example: Two packet sizes: Small (80%), Large (20%) • An average of four small packets are followed by an average of one big packet, e.g., ssssbssssbssss.
Transition Probability (Cont) • Eight small packets followed by two big packets. • Generate a random number x. x< 0.8 ) generate a small packet; otherwise generate a large packet.
Clustering Steps • Take a sample, that is, a subset of workload components. • Select workload parameters. • Select a distance measure. • Remove outliers. • Scale all observations. • Perform clustering. • Interpret results. • Change parameters, or number of clusters, and repeat steps 3-7. • Select representative components from each cluster.
1. Sampling • In one study, 2% of the population was chosen for analysis; later 99% of the population could be assigned to the clusters obtained. • Random selection • Select top consumers of a resource.
2. Parameter Selection • Criteria: • Impact on performance • Variance • Method: Redo clustering with one less parameter • Principal component analysis: Identify parameters with the highest variance.
3. Transformation • If the distribution is highly skewed, consider a function of the parameter, e.g., log of CPU time
4. Outliers • Outliers = data points with extreme parameter values • Affect normalization • Can exclude only if that do not consume a significant portion of the system resources. Example, backup.
5. Data Scaling • Normalize to Zero Mean and Unit Variance: • Weights: xik0 = wk xik wk/ relative importance or wk = 1/sk • Range Normalization: Affected by outliers.
Data Scaling (Cont) • Percentile Normalization:
Distance Metric • Euclidean Distance: Given {xi1, xi2, …., xin} and {xj1, xj2, …., xjn} d={åk=1n (xik-xjk)2}0.5 • Weighted-Euclidean Distance: d=åk=1n {ak(xik-xjk)2}0.5Here ak, k=1,2,…,n are suitably chosen weights for the n parameters. • Chi-Square Distance:
Distance Metric (Cont) • The Euclidean distance is the most commonly used distance metric. • The weighted Euclidean is used if the parameters have not been scaled or if the parameters have significantly different levels of importance. • Use Chi-Square distance only if x.k's are close to each other. Parameters with low values of x.k get higher weights.
Clustering Techniques • Goal: Partition into groups so the members of a group are as similar as possible and different groups are as dissimilar as possible. • Statistically, the intragroup variance should be as small as possible, and inter-group variance should be as large as possible. Total Variance = Intra-group Variance + Inter-group Variance
Clustering Techniques (Cont) • Nonhierarchical techniques: Start with an arbitrary set of k clusters, Move members until the intra-group variance is minimum. • Hierarchical Techniques: • Agglomerative: Start with n clusters and merge • Divisive: Start with one cluster and divide. • Two popular techniques: • Minimum spanning tree method (agglomerative) • Centroid method (Divisive)
Minimum Spanning Tree-Clustering Method • Start with k = n clusters. • Find the centroid of the ith cluster, i=1, 2, …, k. • Compute the inter-cluster distance matrix. • Merge the the nearest clusters. • Repeat steps 2 through 4 until all components are part of one cluster.
Minimum Spanning Tree Example • Step 1: Consider five clusters with ith cluster consisting solely of ith program. • Step 2: The centroids are {2, 4}, {3, 5}, {1, 6}, {4, 3}, and {5, 2}.
Spanning Tree Example (Cont) • Step 3: The Euclidean distance is: • Step 4: Minimum inter-cluster distance = 2. Merge A+B, D+E.
Spanning Tree Example (Cont) • Step 2: The centroid of cluster pair AB is {(2+3) 2, (4+5) 2}, that is, {2.5, 4.5}. Similarly, the centroid of pair DE is {4.5, 2.5}.
Spanning Tree Example (Cont) • Step 3: The distance matrix is: • Step 4: Merge AB and C. • Step 2: The centroid of cluster ABC is {(2+3+1) ¥ 3, (4+5+6) ¥ 3}, that is, {2, 5}.
Spanning Tree Example (Cont) • Step 3: The distance matrix is: • Step 4: Minimum distance is 12.5.Merge ABC and DE Single Custer ABCDE
Dendogram • Dendogram = Spanning Tree • Purpose: Obtain clusters for any given maximum allowable intra-cluster distance.
Nearest Centroid Method • Start with k = 1. • Find the centroid and intra-cluster variance for ith cluster,i= 1, 2, …, k. • Find the cluster with the highest variance and arbitrarily divide it into two clusters. • Find the two components that are farthest apart, assign other components according to their distance from these points. • Place all components below the centroid in one cluster and all components above this hyper plane in the other. • Adjust the points in the two new clusters until the inter-cluster distance between the two clusters is maximum. • Set k = k+1. Repeat steps 2 through 4 until k = n.
Cluster Interpretation • Assign all measured components to the clusters. • Clusters with very small populations and small total resource demands can be discarded. (Don't just discard a small cluster) • Interpret clusters in functional terms, e.g., a business application, Or label clusters by their resource demands, for example, CPU-bound, I/O-bound, and so forth. • Select one or more representative components from each cluster for use as test workload.
Problems with Clustering (Cont) • Goal: Minimize variance. • The results of clustering are highly variable. No rules for: • Selection of parameters • Distance measure • Scaling • Labeling each cluster by functionality is difficult. • In one study, editing programs appeared in 23 different clusters. • Requires many repetitions of the analysis.