Creating Arrays
Creating Arrays. Creating scalars, vectors, matrices Ex. Plotting Graphs Ex. Conversion Table Ex. Plotting functions Ex. Use of matrices in real world. 1. Creating scalars. Assign a value to a variable (i.e. Hardcode) pressure = 10; % pascals temperature = 298; %kelvin


Creating Arrays
E N D
Presentation Transcript
Creating Arrays Creating scalars, vectors, matrices Ex. Plotting Graphs Ex. Conversion Table Ex. Plotting functions Ex. Use of matrices in real world
1. Creating scalars • Assign a value to a variable (i.e. Hardcode) pressure = 10; %pascals temperature = 298; %kelvin • Store the result of an equation pressure = density*R*temperature; • Collect the return value of a function: age = input('Enter your age: '); distance = sind(angleDeg);
2. Creating vectors • There are LOTS of ways to create vectors, based on three simple ideas: • The values in the vector are pre-defined. For example: [ 2 -5 4.4 -96.6] • The values have an addition pattern. For example: [10, 20, 30 ,…100] or [-10 -8 -6 -4 -2 0] • Or even, the total number of values is known! For example: 25 points evenly spaced from 0 to 100.
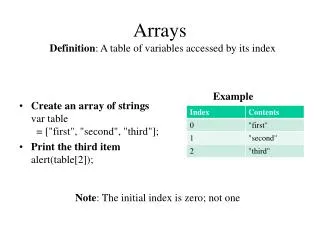
2.1. row vector • Square brackets [] and commas • OR square brackets and white space 1 by 4 1 by 4
2.1. column vector • Square brackets and semi-colons • Or a row vector transposed with the apostrophe 3 by 1 3 by 1
Trivia • What are the true statements? • y is a row vector • y is a column vector • y is a scalar • y contains 4 scalars • y is a 1 by 4 • y is a 4 by 1 • None of these
New operators… [] Use [] to tell MATLAB you are about to hardcode an array , Use a comma or white-space to create new columns ; Use semi-colons to create a new row ’ Use an apostrophe to transpose the array (caution if you are using imaginary numbers…) NO MATTER WHAT YOU DO: KEEP THE ARRAY RECTANGULAR!!!!!
y x y -7 -2 3 8 4 -7 3 -1 x Ex. Plotting graphs • In order to plot, MATLAB needs data points:
y x y -7 -2 3 8 4 -7 3 -1 x Ex. Plotting graphs • In order to plot, MATLAB needs data points:
y x y -7 -2 3 8 4 -7 3 -1 x Ex. Plotting graphs • In order to plot, MATLAB needs data points: MATLAB connects the dots!
y x y -7 -2 3 8 4 -7 3 -1 x Ex. Plotting graphs • In order to plot, MATLAB needs data points: x is an vector of data points y is another vector of data points …for the curious ones, to plot: clc clear x = [-7 -2 3 8]; y = [4 -7 3 -1]; plot(x,y); %plots y vs. x
y x y -7 3 -2 8 4 3 7 -1 x Ex. Plotting graphs • MATLAB plots in order of the data-points: clc clear x = [-7 3 -2 8]; y = [4 3 -7 -1]; plot(x,y); %plots y vs. x
2.2. Patterns (addition only) • For addition pattern, no need to code a lot! The range operator Numbers are separated by +1
2.2. Patterns, cont. • Add an increment to increase by a different amount than +1 An additional value in the middle specifies the increment (aka step-size). +3 +3 +3 +3 +3 +3 +3 +3 >32
2.2. Patterns, cont. • Create a decreasing pattern by using a negative increment! CAUTION: the beginning number must be > the end number. Here 10>3. Note: it works with fractional values. -2.5 -2.5 -2.5 < 3
Pause… • Where has this logic been used before? k = 1:4:25
2.2. Patterns, cont. • To use the apostrophe (single quote) and create a column vector: place brackets first … otherwise? (try it at home..) +3 >32
Ex. Conversion table clc clear % create Celsius vector of data points Celsius = 0:10:100; %0 to 100 by inc. +10 % calculate Fahrenheit Fahrenheit = Celsius * 9/5 + 32; % create/show table <code not shown> EFFICIENT: MATLAB has a built-in loop that applies the formula to EACH element of the vector Celsius 1 line of code = 11 calculations! Fahrenheit is a ___ by ____.
2.3. Specific amount of data points • Sometimes, the increment isn’t so important (or known) vs. HOW MANY points there are. • A built-in function called linspace() spaces elements linearly in an array. • What does this mean? • The distance between consecutive data points is a constant across the array.
Ex. Plotting sine • How many points would it take to plot correctly the sine function on the interval ? • 2 points? • 5 points? • 10 points? • 100 points? • 1,000,000?
Ex. Plotting sine • Why linearly spaced? These 9 points? Or These 9 points?
>>doc linspace<enter> linspace Generate linearly spaced vectors Syntax y = linspace(a,b)y = linspace(a,b,n) Description The linspace function generates linearly spaced vectors. It is similar to the colon operator ":", but gives direct control over the number of points. y = linspace(a,b) generates a rowvector y of 100 points linearly spaced between and including a and b. y = linspace(a,b,n) generates a row vector y of n points linearly spaced between and including a and b. For n < 2, linspace returns b.
Ex. Plotting sine clc clear %x coordinates angles = linspace(0, 2*pi, 9); %calculate y(x) = sin(x) y = sin(angles); %plot sine as a function of the angle plot(angles,y) Will 9 data points really be enough?
Ex. Plotting sine clc clear %x coordinates angles = linspace(0, 2*pi, 9); %calculate y(x) = sin(x) y = sin(angles); %plot sine as a function of the angle plot(angles,y) Will 9 data points really be enough?
Ex. Plotting sine clc clear %x coordinates angles = 0: :2*pi; %without linspace()? %calculate y(x) = sin(x) y = sin(angles); %plot sine as a function of the angle plot(angles,y) Remember 9 points…
2.3. linspace(), cont. • MATLAB runs out of space to display? When MATLAB cannot display all the elements on one line, it simply indicates the column numbers for each line.
2.3. linspace(), cont. • Transpose the return value of linspace() to create a column vector
2.3. linspace(), cont. ?????? %no third argument Omitthe third argument uses a default of _______ data points!
3. Creating Matrices • Simply a combination of all operators introduced with vectors! • Square brackets [ ] • Spaces or commas , , • Semi-colons ; • Apostrophes ‘ • Just keep in mind: only RECTANGULAR matrices
3.1. Matrices: hard-coding • Use semi-colons to create new rows. • Good or bad? Why? 2 by 3 3 by 2
3.2. Concatenating matrices • Assume variable a from the previous slide. Use it as a reference to create a new variable: “CONCATENATING” The art of “gluing” vectors and matrices together
Finish this code.. Concatenate! clc clear % create Celsius vector of data points Celsius = 0:10:100; %0 to 100 by inc. +10 % calculate Fahrenheit Fahrenheit = Celsius * 9/5 + 32; % create/show table table = _________________________
3.3 Using colons • Combine ALL methods necessary JUST KEEP THE ARRAY RECTANGULAR
Creating arrays is great but… What to do with them???
Basic functions on arrays CAUTION: A function will return different values depending on whether the argument is a vector or a matrix!
Ex. vector: Temperatures clc clear % engine temperature temps = [45.5,56.7,99.9,42,12,29]; % determine minimum,maximum,average temperature minTemp = min(temps) maxTemp = max(temps) avgTemp = mean(temps) Do not use min =, or max=…, or mean= … These keywords are reserved by MATLAB!
Ex. matrix: Scores clc clear % scores from playing. Col1 = player1, col2 = player2…etc. scores = [45,34,56; 67,3,45; 22,55,99]’; %transposed! % determine minimum,maximum,averagescores minScores= min(scores) ? maxScores= ______________ avgScores= ______________
Making Arrays We've just begun arrays – much more to follow (2 weeks total) Arrays frequently holds a large number of values, which is usually what data files contains. Matrices typically involve nested loops (although later we’ll see that this can sometimes be avoided…) Next time: using values inside the array (“referencing” them) changing arrays (inserting values/deleting values) learning the MATLAB array tools
Try it at home! • Create a vector for each category of this class (assignments, homework, quizzes, exams, extra credit… ). Find your minimum, maximum, average grade in each category. • Search into the sum() function, and calculate your grade using the weighted averages! – or wait till next time!