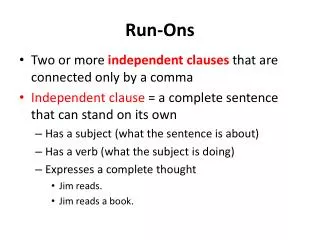

EYE ONS
E N D
Presentation Transcript
Is wind power free? • South Dakota has enough wind to generate 55 percent of the nation’s electricity. But what would be the cost—the opportunity cost—of that electricity? EYE ONS
3 The Economic Problem CHAPTER CHECKLIST When you have completed your study of this chapter, you will be able to • 1Explain and illustrate the concepts of scarcity, production efficiency, and tradeoff using the production possibilities frontier. • 2 Calculate opportunity cost. • 3 Explain what makes production possibilities expand. • 4 Explain how people gain from specialization and trade.
3.1 PRODUCTION POSSIBILITIES • Production Possibilities Frontier • Production possibilities frontier • The boundary between the combinations of goods and services that can be produced and the combinations that cannot be produced, given the available factors of production and the state of technology. • The PPF is a valuable tool for illustrating the effects of scarcity and its consequences.
3.1 PRODUCTION POSSIBILITIES Figure 3.1 shows the PPF for cell phones and DVDs. Each point on the graph represents a column of the table. The line through the points is the PPF.
3.1 PRODUCTION POSSIBILITIES • The PPF puts three features of production possibilities in sharp focus: • Attainable and unattainable combinations • Efficient and inefficient production • Tradeoffs and free lunches
3.1 PRODUCTION POSSIBILITIES • Attainable and Unattainable Combinations • Because the PPF shows the limits to production, it separates attainable combinations from unattainable ones. • Figure 3.2 on the next slide illustrates the attainable and unattainable combinations.
3.1 PRODUCTION POSSIBILITIES We can produce at any point inside the PPF or on the frontier. We cannot produce at any point outside the PPF such as point G. The PPF separates attainable combinations from unattainable combinations.
3.1 PRODUCTION POSSIBILITIES • Efficient and Inefficient Production • Production efficiency is a situation in which we cannot produce more of one good or service without producing less of something else. • Figure 3.3 on the next slide illustrates the distinction between efficient and inefficient production.
3.1 PRODUCTION POSSIBILITIES 1. When production is on the PPF, such as at point E or D, production is efficient. 2.If production were inside the PPF, such as at point H, more could be produced of both goods without forgoing either good. Production is inefficient.
3.1 PRODUCTION POSSIBILITIES • Tradeoffs and Free Lunches • A tradeoffis an exchange—giving up one thing to get something else. • A free lunchis a gift—getting something without giving up something else. • Figure 3.3 on the next slide illustrates the distinction between a tradeoff and a free lunch.
3.1 PRODUCTION POSSIBILITIES 3. When production is on the PPF, we face a tradeoff. 4.If production were inside the PPF, there would be a free lunch. Moving from point H to point D does not involve a tradeoff.
3.2 OPPORTUNITY COST • The Opportunity Cost of a Cell Phone • The opportunity cost of a cell phone is the decrease in the quantity of DVDs divided by the increase in the number of cell phones as we move along the PPF. • Figure 3.4 illustrates the calculation of the opportunity cost of a cell phone.
3.2 OPPORTUNITY COST Moving from A to B, 1 cell phone costs 1 DVD.
3.2 OPPORTUNITY COST Moving from B to C, 1 cell phone costs 2 DVDs.
3.2 OPPORTUNITY COST Moving from C to D, 1 cell phone costs 3 DVDs.
3.2 OPPORTUNITY COST Moving from D to E, 1 cell phone costs 4 DVDs.
3.2 OPPORTUNITY COST Moving from E to F, 1 cell phone costs 5 DVDs.
EYE on the ENVIRONMENT Is Wind Power Free? • Wind power is not free. • Its opportunity cost includes: • the cost of wind turbines, • the cost of transmission lines, and • power transmission loss. • Wind turbines produce electricity only when there is wind, which is, at best, 40 percent of the time and, on average, about 25 percent of the time. • Also some of the best wind farm locations are a long way from major population centers, so transmission lines would be long and power transmission losses large.
EYE on the ENVIRONMENT Is Wind Power Free? • Point A is a point of efficient electricity production. • If the United States produced 55 percent of its electricity using South Dakota wind power, • the United States would be operating inside its PPF at a point such as Z.
3.2 OPPORTUNITY COST • Increasing Opportunity Cost • The opportunity cost of a cell phone increases as more cell phones are produced.
3.2 OPPORTUNITY COST • Slope of the PPF and Opportunity Cost • The magnitude of the slope of the PPF measures opportunity cost. • The slope of the PPF in Figure 3.4 measures the opportunity cost of a cell phone. • The PPF is bowed outward, as more water is produced, the PPF becomes steeper and the opportunity cost of a cell phone increases.
3.2 OPPORTUNITY COST • Opportunity Cost Is a Ratio • The opportunity cost of a cell phone is the quantity of DVDs forgone divided by the increase in the quantity of cell phones gained. • The opportunity cost of a DVD is the quantity of cell phones forgone divided by the increase in the quantity of DVDs gained. • When the opportunity cost of a cell phone is x DVDs, the opportunity cost of a DVD is 1/x cell phones.
3.2 OPPORTUNITY COST • Increasing Opportunity Costs Are Everywhere • Just about every activity has an increasing opportunity cost.
3.3 ECONOMIC GROWTH If we produce at point J, we produce only cell-phone factories and no cell phones. If we produce at point L, we produce cell phones and no cell-phone factories. At L, consumption remains at 5 million cell phones every year.
3.3 ECONOMIC GROWTH 1. But if we cut production of cell phones to 3 million this year, we can produce 2 cell-phone factories at point K. 2. Then next year, our PPF shifts outward because we have more capital. We can consume at a point outside our original PPF, such as K'.
3.4 SPECIALIZATION AND TRADE • Comparative Advantage • Comparative advantage is the ability of a person to perform an activity or produce a good or service at a lower opportunity cost than someone else. • Joe and Liz operate smoothie bars and produce smoothies and salads.
3.4 SPECIALIZATION AND TRADE Liz's Smoothie Bar In an hour, Liz can produce either 30 smoothies or 30 salads. Liz's opportunity cost of producing 1 smoothie is 1 salad. Liz's opportunity cost of producing 1 salad is 1 smoothie. Each hour, Liz splits her time equally between smoothies and salads and produces 15 smoothies and 15 salads.
3.4 SPECIALIZATION AND TRADE Joe's Smoothie Bar In an hour, Joe can produce either 6 smoothies or 30 salads. Joe's opportunity cost of producing 1 smoothie is 5 salads. Joe's opportunity cost ofproducing 1 salad is 1/5 smoothie. Each hour, Joe spends 50 minutes producing smoothies and makes 5 smoothies. In the other 10 minutes, he produces 5 salads.
3.4 SPECIALIZATION AND TRADE • Liz’s Absolute Advantage • Absolute advantage is a situation in which one person is more productive than another person in several or even all activities. • Liz is three times as productive as Joe—Liz can produce 15 smoothies and 15 salads an hour and Joe can produce only 5 smoothies and 5 salads an hour.
3.4 SPECIALIZATION AND TRADE • Liz’s Comparative Advantage • Liz’s opportunity cost of a smoothie is 1 salad. • Joe’s opportunity cost of a smoothie is 5 salads. • Liz’s opportunity cost of a smoothie is less than Joe’s, so Liz has a comparative advantage in producing smoothies.
3.4 SPECIALIZATION AND TRADE • Joe’s Comparative Advantage • Joe’s opportunity cost of a salad is 1/5 smoothie. • Liz’s opportunity cost of a salad is 1 smoothie. • Joe’s opportunity cost of a salad is less than Liz’s, • so Joe has a comparative advantage in producing salads.
3.4 SPECIALIZATION AND TRADE • Achieving Gains from Trade • Liz and Joe specialize in producing the good in which they have a comparative advantage: • Liz produces 30 smoothies. • Joe produces 30 salads.
3.4 SPECIALIZATION AND TRADE • Liz and Joe trade: • Liz sells Joe 10 smoothies and buys 20 salads. • Joe sells Liz 10 salads and buys 20 smoothies. • After trade: • Liz has 20 smoothies and 20 salads. • Joe has 20 smoothies and 20 salads.
3.4 SPECIALIZATION AND TRADE • Gains from trade: • Liz gains 5 smoothies and 5 salads an hour—she originally produced 15 smoothies and 15 salads. • Joe gains 5 smoothies and 5 salads an hour—he originally produced 5 smoothies and 5 salads. • Figure 3.7 on the next slide illustrates the gains from trade.
3.4 SPECIALIZATION AND TRADE 1. Joe and Liz each produce at point A on their PPFs. Joe has a comparative advantage in producing salads. Liz has a comparative advantage in producing smoothies.
3.4 SPECIALIZATION AND TRADE Joe and Liz specialize in producing the good in which they have a comparative advantage. 2. Joe produces 30 salads at point B on his PPF. 2. Liz produces 30 smoothies at point B on her PPF.
3.4 SPECIALIZATION AND TRADE Joe and Liz trade salads and smoothies at a price of 2 salads per smoothie. 3.Joe sells 20 salads to Liz and buys 10 smoothies. Joe consumers at point C. 3.Liz sells 10 smoothies to Joe and buys 5 salads. Liz consumes at point C. Both consume at point C, which is outside their PPFs.