Download
1 / 47
480 likes | 684 Vues
People of Asian Ethnicities. A brief overview of the 2013 Census data Dr Robert Didham Statistics NZ and Waikato University. What is ethnicity?. Definition (from the NZ Standard of Ethnicity):

E N D
People of Asian Ethnicities A brief overview of the 2013 Census data Dr Robert Didham Statistics NZ and Waikato University
What is ethnicity? Definition (from the NZ Standard of Ethnicity): • Ethnicity is a measure of cultural affiliation, as opposed to race, ancestry, nationality or citizenship. • Ethnicity is self perceived and people can belong to more than one ethnic group. An ethnic group is made up of people who have some or all of the following characteristics: • a common proper name [group identity] • one or more elements of common culture which need not be specified, but may include religion, customs, or language [functional connections - though this has since been shown to be seriously problematic] • unique community of interests, feelings and actions [“unique” is debateable] • a shared sense of common origins or ancestry, and [shared histories] • a common geographic origin. [this relates to imagined homelands]
What is ethnicity NOT? So, if we don’t quite see what ethnicity is … • … can we get some idea by thinking about what it is not
Not skin colour • As this Scot will tell you
Not race (in the current sense) • A concept this flawed needs no further explanation • But people are hell-bent on EXPLAINING: Race is not firmly biologically based but rather is a “construct of human variability based on perceived differences in biology, physical appearance, and behavior” (IOM, 1999).
Not citizenship • NZ citizens, all, but none would necessarily describe themselves as “NZer”
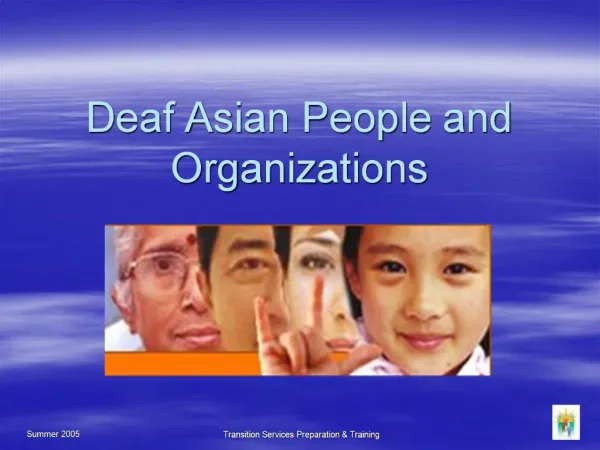
Not “non-English speaking” • Yes – these folks do all speak excellent English
Not religion Around Christchurch – not new photos as the last one shows
And not food • Such as this “ethnic” dish!
Why does this matter? Data PF 1 Data RW0 RW1 PF 2 PF 3 Where RW = real world and PF = policy field
Census data • 1851 to 1911 primarily used country of birth • Ethnicity first collected in 1916 • Early collections tended to concentrate on full blood and mixed blood • Terminology changed over time (e.g. race, ethnic origin, ethnicity)
1916 Ethnicity European Note: pie charts show responses at lowest published level, not number of people (and generally pie charts are to be avoided)
1956 Ethnicity European
2013 Ethnicity New Zealand European
Birthplace mattersEuropean and Asian 2006 2013
Multiple EthnicitiesPeople of Asian Ethnicities 2013 Census Male
Output and analysis of data • Historic approaches: • Proportion of blood – reflects the views at the time • Combinations a common form of output 1916 onwards • Half or more – hides complexity • Prioritisation – only ever used if data sources dictate • Total response data • Simplest - tends to hide complexity • Combinations of ethnicities • Does add to PopTotal, richest in information • Many categories (64 at L1, 2.1million at L2, and 2.1*1068 at L4)
Key points to remember • Always check the questionnaire • Can often explain apparently strange things (next slide) • Multiple responses: • Data does not add to the total • Always use the number specified as denominator • (i.e. exclude not specified and residual counts) • Ethnicities can change • A person may change their ethnic identification • People may report different ethnicities in different contexts
Tickbox tyranny • Example: Indian • There is a tickbox labelled “Indian” • Out of 156,500 people of an Indian ethnicity, 143,500 ticked “Indian”
Avoid prioritiseddata • Multiple responses: • People may have more than one ethnicity • A person’s ethnicities may change over time • Avoid prioritised data whenever possible • Not a valid treatment of ethnicity • No information on relative strength of affiliations • Groups, including Maori, may be disadvantaged • Hides diversity and complexity
Problem with prioritisationPercentage losses to groupingsCensus 2013
Growth of ethnic groupings1916-2013 Percent of population Note scale not strictly linear Census year
Asian births and deaths1998-2012 Births (Asian ethnicity of child) Deaths (Asian ethnicity)
People of Asian Ethnicities 2013 New Zealand Auckland Old Auckland City (approximately central Auckland)
City of Migrants – old Auckland City area NZ Born Total and NZ Born Asian Total and Total Asian
Chinese and Indian EthnicitiesAuckland Urban ZonesCensus 2013
What are the changes? • Age structure. • Birthplace • Language • Qualifications • Families and interethnic partnering
Age Structure Changing 2006 Census 2013 Census % Change Number of people with one or more Asian ethnicities: 354,552 471,711 Up 33% Number of Asian 65 years and over: 16,071 27,309 Up 70% Number of Asian under 5 years: 23,913 35,898 Up 50%
Birthplacepeople with ethnicities in the Asian grouping Population 2006 2013 % • Born in NZ: 70,650 105,728 50 • Born in Overseas: 281,044 360,893 28 • Born in Asia: 240,537 306,202 27 • Born in Pacific: 31,338 43,738 40 • Ten years or more in NZ and specified born overseas: 79,458 162,599 105
Languagepeople with ethnicities in the Asian grouping • Speaks English: 393,237 (83%) • Compared with 2006: 290,469 (82 %) • Speaks one or more other languages: 325,677 (69%) • Compared with 2006: 254,763 (72 %)
Languagespeople with ethnicities in the Asian grouping • Top languages other than English:
Other Languagespeople with ethnicities in the Asian grouping Other languages in the top 40 (of over 170) include: • Other important languages of Asia: • Tamil, Telegu, Kannada, Malayalam, • Sinhala, Marathi, Bengali • Thai, Khmer, Bahasa Malay, Vietnamese • Min, Tieu-Chow, Hakka, Wu • Colonial and local languages • French, Spanish, Maori, Samoan, Fijian • With increasing number of speakers of: • Lao, Burmese, Cebuano, Pashto, etc
Percent University GraduatesSelected ethnicities by sex 2013
Percent Older University GraduatesSelected ethnicities by sex, 65plus, 2013
Families and interethnic partnering Opposite-sex couples, 2013 Census
Families and interethnic partnering Opposite-sex couples, 2013 Census
Key themes to take to the workshops • Treating the “Asian Ethnic Group” as if homogenous can be misleading and prejudicial • High level of diversity with the grouping of ethnicities. • Among people of the same ethnicity there is substantial diversity • Age and gender differences • Educational differences • Health histories • Migration histories and family connectedness • Transnational connections • Language skills and settlement outcomes • Ethnicity may not be the best way to distinguish need groups or to define health or education delivery • Birthplace and years in NZ may be bigger factors • Location within NZ and intercommunity connections influence uptake of facilities • Age may be a key factor • Mental health, diabetes and HIV risks vary across groups • Migration histories and local exposure to racism • Economic well-being • Access to health care and education varies • Specific groups have different risk factors and support requirements • Intersecting policy fields • In particular immigration, education and health policies need to interface more openly • Access to social assistance becoming less transparent and less flexible • Eligibility for education assistance influences settlement and personal development • Link between skills as a factor in migration process alongside real world employment opportunities and flexibility is career development
That’s all folks For now anyway Feel free to contact: robertdidham@hotmail.com