Download
1 / 86

E N D
The Intergovernmental Panel on Climate Change:What do they have to tell the world?Gordon J. Aubrecht, IIauthor of Energy: Physical, Environmental, and Social Impact (Prentice Hall, 2006)http://vig.prenhall.com/catalog/academic/product/0,1144,0130932221,00.htmlPhysics Education Research GroupOhio State University Marion CampusTalk presented at OSU science cafe, Old Long’s Bookstore, 2 April 2008
Abstract: The Fourth Assessment Report of the IPCC released in 2007 dealt with the scientific basis for climate change, consequences of emissions, and mitigation and adaptation. This talk will outline the main results of the world scientific consensus on climate change and what that will mean for our future.The Intergovernmental Panel on Climate Change (IPCC) shared last year’s Nobel Peace Prize “for their efforts to build up and disseminate greater knowledge about man-made climate change, and to lay the foundations for the measures that are needed to counteract such change.”There are three working groups of the IPCC (the physical science basis; impacts, adaptation, and vulnerability; and mitigation of climate change) that issued the reports in 2007. I focus on what these reports say about human effects on Earth.
All of us live on this precious jewel of a planet. How many of us have not been moved to see the photographs of Earth from space?But now there are more than 6.5 billion of us here, and nearly half must live on under $2 a day.The poorest people live in a world shaped by the rich countries.
Many of you have heard of the IPCC. For those of you who have not, it is run by the UN and the WMO and is made up of scientific experts who comb through what is known in the scientific literature and summarize the findings. Diversity of views is solicited. About one-third of the scientists in the first assessment participated in the second, about one-third who were in the second participated in the third, and so on. Governments (180 members) vote line by line on the Summaries for Policymakers.(You may have heard of the resistance of the US and China to these reports, which do reflect their objections.)
Here is an extremely condensed summary of the results of the four assessments:1990 First Assessment Report“The unequivocal detection of the enhanced greenhouse effect from observations is not likely for a decade or more.”1995 Second Assessment Report“The balance of evidence suggests a discernable human influence on global climate.”2001 Third Assessment Report“There is new and stronger evidence that most of the warming observed over the last 50 years is attributable to human activities.”2007 Fourth Assessment Report“Most of the observed increase in globally averaged temperatures since the mid-20th century is very likely due to the observed increase in anthropogenic greenhouse gas concentrations.”
Terminology used by IPCCLikelihood of the occurrence / outcomeVirtually certain >99% probability Very likely 90 to 99% probabilityLikely 66 to 90% probabilityAbout as likely as not 33 to 66% probabilityUnlikely 10 to 33% probabilityVery unlikely 1 to 10% probabilityExceptionally unlikely <1% probability
Let me repeat the last statement from the 2007 Fourth Assessment Report, which may not have sounded very impressive:“Most of the observed increase in globally averaged temperatures since the mid-20th century is very likely due to the observed increase in anthropogenic greenhouse gas concentrations.”Very likelymeansa 90 to 99% probability! IPCC is not kidding around about this.
The IPCC report actually comes from amalgamation of results from three separate Working Groups: the scientific basis (WG1); impacts, adaptation, and vulnerability (WG2); and mitigation of climate change (WG3).
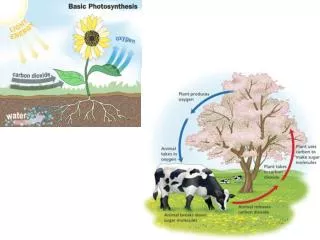
Why CO2 is implicatedHumans began to affect the world when people began to clear land and grow crops. The industrial revolution involved fossil fuel burning on an unprecedented scale.
How human CO2 is implicated Photosynthesis — on land or in the sea — always takes more of the lower-mass carbon (carbon-12) from the mix of available CO2. So carbon fixed by plants will always have a 13C value less than that of the source CO2.
IPCC Special Report on Emission Scenarios (SRES)The SRES scenarios do not include additional climate initiatives, which means that no scenarios are included that explicitly assume implementation of the United Nations Framework Convention on Climate Change or the emissionstargets of the Kyoto Protocol.
A1. The A1 storyline and scenario family describes a future world of very rapid economic growth, global population that peaks in mid-century and declines thereafter, and the rapid introduction of new and more efficient technologies. Major underlying themes are convergence among regions, capacity building and increased cultural and social interactions, with a substantial reduction in regional differences in per capita income. The A1 scenario family develops into three groups that describe alternative directions of technological change in the energy system. The three A1 groups are distinguished by their technological emphasis: fossil intensive (A1FI), non fossil energy sources (A1T), or a balance across all sources (A1B) (where balanced is defined as not relying too heavily on one particular energy source, on the assumption that similar improvement rates apply to all energy supply and end use technologies).
A2. The A2 storyline and scenario family describes a very heterogeneous world. The underlying theme is self reliance and preservation of local identities. Fertility patterns across regions converge very slowly, which results in continuously increasing population. Economic development is primarily regionally oriented and per capita economic growth and technological change more fragmented and slower than other storylines.
B1. The B1 storyline and scenario family describes a convergent world with the same global population, that peaks in mid-century and declines thereafter, as in the A1 storyline, but with rapid change in economic structures toward a service and information economy, with reductions in material intensity and the introduction of clean and resource efficient technologies. The emphasis is on global solutions to economic, social and environmental sustainability, including improved equity, but without additional climate initiatives.
B2. The B2 storyline and scenario family describes a world in which the emphasis is on local solutions to economic, social and environmental sustainability. It is a world with continuously increasing global population, at a rate lower than A2, intermediate levels of economic development, and less rapid and more diverse technological change than in the B1 and A1 storylines. While the scenario is also oriented towards environmental protection and social equity, it focuses on local and regional levels.
An illustrative scenario was chosen for each of the six scenario groups A1B, A1FI, A1T, A2, B1 and B2. All should be considered equally sound. Do we know they are actually predictive?Of course not, but they are representative.
“Defining what is dangerous anthropogenic interferencewith the climate system and, consequently, the limits to beset for policy purposes are complex tasks that can only bepartially based on science, as such definitions inherentlyinvolve normative judgments.”—WG3
Table 1. A simple typology of uncertaintiesType UnpredictabilityIndicative examples of sources Projections of human behaviour not easily amenable to prediction (e.g., evolution of political systems).Chaotic components of complex systems.Typical approaches or considerationsUse of scenarios spanning a plausible range, clearly stating assumptions, limits considered, and subjective judgments.Ranges from ensembles of model runs.
Table 1. A simple typology of uncertaintiesType Structural uncertaintyIndicative examples of sources Inadequate models, incomplete or competing conceptual frameworks, lackof agreement on model structure, ambiguous system boundaries or definitions, significant processes or relationships wrongly specified or not considered.Typical approaches or considerationsSpecify assumptions and system definitions clearly, compare models with observations for a range of conditions, assess maturity of the underlying science and degree to which understanding is based on fundamental concepts tested in other areas.
Table 1. A simple typology of uncertaintiesType Value uncertaintyIndicative examples of sources Missing, inaccurate or non-representative data, inappropriate spatial or temporalresolution, poorly known or changing model parameters.Typical approaches or considerationsAnalysis of statistical properties of sets of values (observations, model ensembleresults, etc); bootstrap and hierarchical statistical tests; comparison of models with observations.
This Tony Auth cartoon (published in The Philadelphia Inquirer on April 10, 2007) gives a slightly scary view of the IPCC Fourth Assessment Report
WG1The global atmospheric nitrous oxide concentration increased from a pre-industrial value of about 270 ppb to 319 ppb in 2005. The growth rate has been approximately constant since 1980. More than a third of all nitrous oxide emissions are anthropogenic and are primarily due to agriculture.The combined radiative forcing due to increases in carbon dioxide, methane, and nitrous oxide is +2.30 [+2.07 to +2.53] W m–2, and its rate of increase during the industrial era is very likely to have been unprecedented in more than 10,000 years.
WG1“Warming of the climate system is unequivocal, as is now evident from observations of increases in global average air and ocean temperatures, widespread melting of snow and ice, and rising global average sea level.”
WG1“At continental, regional and ocean basin scales, numerous long-term changes in climate have been observed. These include changes in arctic temperatures and ice, widespread changes in precipitation amounts, ocean salinity, wind patterns and aspects of extreme weather including droughts, heavy precipitation, heat waves and the intensity of tropical cyclones.” “Palaeoclimatic information supports the interpretation that the warmth of the last half century is unusual in at least the previous 1,300 years. The last time the polar regions were significantly warmer than present for an extended period (about 125,000 years ago), reductions in polar ice volume led to 4 to 6 m of sea level rise.”
WG1“Most of the observed increase in global average temperatures since the mid-20th century is very likely due to the observed increase in anthropogenic greenhouse gas concentrations. This is an advance since the TAR’s conclusion that ‘most of the observed warming over the last 50 years is likely to have been due to the increase in greenhouse gas concentrations’. Discernible human influences now extend to other aspects of climate, including ocean warming, continental-average temperatures, temperature extremes and wind patterns.” “For the next two decades, a warming of about 0.2 °C per decade is projected for a range of SRES emission scenarios. Even if the concentrations of all greenhouse gases and aerosols had been kept constant at year 2000 levels, a further warming of about 0.1 °C per decade would be expected.” “There is now higher confidence in projected patterns of warming and other regional-scale features, including changes in wind patterns, precipitation and some aspects of extremes and of ice.”
WG1“Anthropogenic warming and sea level rise would continue for centuries due to the time scales associated with climate processes and feedbacks, even if greenhouse gas concentrations were to be stabilised.”
WG1“Both past and future anthropogenic carbon dioxide emissions will continue to contribute to warming and sea level rise for more than a millennium, due to the time scales required for removal of this gas from the atmosphere.”If T ~ 1.5 °C - 2.5 °C, 20% - 30% of plants and animals at high risk of extinction.
Top Twenty-Five Annual Global Mean Temperatures through 2007 (°C) Rank Year Combined Year Land Year Ocean
WG2 specific scenariosObservational evidence from all continents and most oceans shows that many natural systems are being affected by regional climate changes, particularly temperature increases.A global assessment of data since 1970 has shown it is likely that anthropogenic warming has had a discernible influence on many physical and biological systems.Other effects of regional climate changes on natural and human environments are emerging, although many are difficult to discern due to adaptation and non-climatic drivers.More specific information is now available across a wide range of systems and sectors concerning the nature of future impacts, including for some fields not covered in previous assessments.
WG2 specific scenariosProjected climate change-related exposures are likely to affect the health status of millions of people, particularly those with low adaptive capacity, through: increases in malnutrition and consequent disorders, with implications for child growth and development; increased deaths, disease and injury due to heat waves, floods, storms, fires and droughts; the increased burden of diarrheal disease; the increased frequency of cardio-respiratory diseases due to higher concentrations of ground level ozone related to climate change; and, the altered spatial distribution of some infectious disease vectors.
Africa (selected): Agricultural production, including access to food, in many African countries and regions is projected to be severely compromised by climate variability and change. The area suitable for agriculture, the length of growing seasons and yield potential, particularly along the margins of semi-arid and arid areas, are expected to decrease. This would further adversely affect food security and exacerbate malnutrition in the continent. In some countries, yields from rain-fed agriculture could be reduced by up to 50% by 2020.
Asia (selected):Glacier melt in the Himalayas is projected to increase flooding, and rock avalanches from destabilised slopes, and to affect water resources within the next two to three decades. This will be followed by decreased river flows as the glaciers recede.Australia and New Zealand (selected):Significant loss of biodiversity is projected to occur by 2020 in some ecologically-rich sites including the Great Barrier Reef and Queensland Wet Tropics. Other sites at risk include Kakadu wetlands, southwest Australia, sub-Antarctic islands and the alpine areas of both countries.
Europe (selected):Nearly all European regions are anticipated to be negatively affected by some future impacts of climate change and these will pose challenges to many economic sectors. Climate change is expected to magnify regional differences in Europe’s natural resources and assets. Negative impacts will include increased risk of inland flash floods, and more frequent coastal flooding and increased erosion (due to storminess and sea-level rise). The great majority of organisms and ecosystems will have difficulties adapting to climate change. Mountainous areas will face glacier retreat, reduced snow cover and winter tourism, and extensive species losses (in some areas up to 60% under high emission scenarios by 2080).
Latin America (selected):By mid-century, increases in temperature and associated decreases in soil water are projected to lead to gradual replacement of tropical forest by savanna in eastern Amazonia. Semi-arid vegetation will tend to be replaced by arid-land vegetation. There is a risk of significant biodiversity loss through species extinction in many areas of tropical Latin America.Polar Regions (selected): In the Polar Regions, the main projected biophysical effects are reductions in thickness and extent of glaciers and ice sheets, and changes in natural ecosystems with detrimental effects on many organisms including migratory birds, mammals and higher predators. In the Arctic, additional impacts include reductions in the extent of sea ice and permafrost, increased coastal erosion, and an increase in the depth of permafrost seasonal thawing.Small islands (selected): Sea-level rise is expected to exacerbate inundation, storm surge, erosion and other coastal hazards, thus threatening vital infrastructure, settlements and facilities that support the livelihood of island communities.
North America (all):Warming in western mountains is projected to cause decreased snowpack, more winter flooding, and reduced summer flows, exacerbating competition for over-allocated water resources. Disturbances from pests, diseases, and fire are projected to have increasing impacts on forests, with an extended period of high fire risk and large increases in area burned.Moderate climate change in the early decades of the century is projected to increase aggregate yields of rain-fed agriculture by 5-20%, but with important variability among regions. Major challenges are projected for crops that are near the warm end of their suitable range or depend on highly utilised water resources.Cities that currently experience heat waves are expected to be further challenged by an increased number, intensity and duration of heat waves during the course of the century, with potential for adverse health impacts. Elderly populations are most at risk.Coastal communities and habitats will be increasingly stressed by climate change impacts interacting with development and pollution. Population growth and the rising value of infrastructure in coastal areas increase vulnerability to climate variability and future climate change, with losses projected to increase if the intensity of tropical storms increases. Current adaptation is uneven and readiness for increased exposure is low.