Download
1 / 34
340 likes | 362 Vues
Explore the evolution of Warm Mix Asphalt (WMA) technology and its benefits. Discover the significance of Life Cycle Assessment (LCA) in evaluating environmental, energy, and material impacts of WMA. Learn about processes, inputs, and outputs associated with WMA production, including energy consumption, emissions, and waste generation. Uncover the challenges and considerations in conducting a comprehensive LCA for WMA projects.

E N D
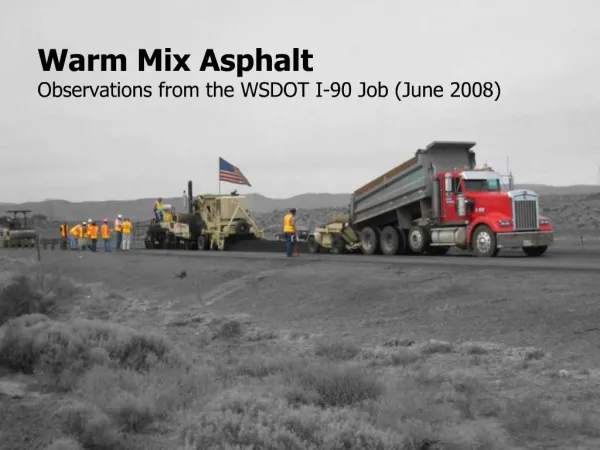
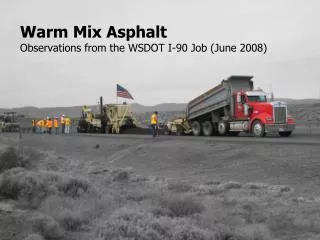
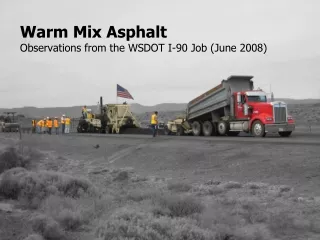
Warm Mix AsphaltObservations from the WSDOT I-90 Job (June 2008)
Where are we with WMA? What do we know and not know? Life cycle assessment I-90 Observations
WMA has been around in its current iteration since about the mid 1990s but has existed in some for or another for at least 30 years. 1970s 1995 2009 WMA standard use starts in some places current WMA starts Older WMA-like products Boeing and others
The classic WMA benefits are enticing. • Reduced plant fuel consumption • Reduced emissions • At the plant • Fugitive emissions • Reduced viscosity during construction • Better compaction • Longer haul distances • Cold weather paving • Same viscosity during operation • Some have greater viscosity
Based on published reports and presentations, here’s what we think we know.
A “life cycle assessment” can help assess the energy, environmental and materials picture.
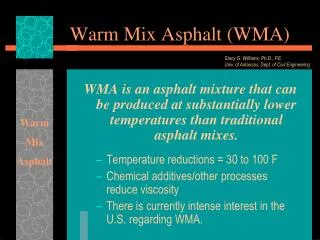
Life cycle assessment (LCA) is a good tool to assess the overall life cycle impact of WMA. • Life cycle assessment (LCA) • A protocol to assess the environmental, economic, and social impacts of an industrial system. • The life cycle of the industrial system extends from cradle-to-grave: from materials acquisition and production, through manufacturing, system use and maintenance, and finally through the end of the system’s life. • Essentially an accounting tool.
refinery transport transport oil extraction other inputs transport Aggregate Quarry hma plant water fuel other outputs transport placement An example of LCA processes, inputs and outputs to consider for HMA paving. emissions waste hazardous waste
For a given unit of production (e.g., 1 lane-mile of pavement) a typical LCA gives a range of outputs. • Amount of materials used (tonnes) • Total energy use (MJ) • Water consumption (kg) • Emissions • Global warming potential (tonnes of CO2 equivalent) • Nitrogen oxides – NOx(kg) • Sulfur dioxide – SO2 (kg) • Particulate matter – PM10 (kg) • Carbon Monoxide – CO (kg) • Toxic things • Human toxicity potential • Mercury – Hg (g) • Lead – Pb (g) • Hazardous waste (kg) • Polycyclic aromatic hydrocarbons (PAHs)
An example of a LCA output relating to energy consumption in pavement construction. Amount of Energy Required to Build 1 Lane-Mile of Pavement • Notes: • 90%+ from manufacturing • Numbers change a lot depending on assumption 9-inch CRC Pavement (6 inches base material) 3% 3.7 TJ 94% 3% 12-inch HMA Pavement (6 inches base material) 3.0 TJ 7% 91% 2% 4.0 TJ Data from: Zapata and Gambatese, Energy Consumption of Asphalt and Reinforced Concrete Pavement Materials and Construction, J. of Inf. Sys., vol. 11, issue 1, p. 9-20.
An example of a LCA output relating to the contribution of different processes to environmental outcomes. Contribution of Main Processes on Environmental Impacts of HMA Hassan, M.M. (2009). Life-Cycle Assessment of Warm-Mix Asphalt: An Environmental and Economic Perspective. Presentation at the 88th Annual Meeting of the Transportation Research Board, Washington, D.C., 11-15 January, 2009.
An example of a LCA output relating to waste production in roadways. Waste Generated by 1 Lane-Mile of Pavement • Notes: • Most from manufacturing and EOL • Numbers change a lot depending on assumption 9-inch CRC Pavement (6 inches base) 1% 41% 6% 52% 2,225 tons 10-inch HMA Pavement (15 inches base) 38% 2% 1% 59% 2,852 tons 2,000 tons Data from: Rajendran and Gambatese, Solid Waste Generation in Asphalt and Reinforced Concrete Roadway Life Cycles, J. of Inf. Sys., vol. 13, issue 2, p. 88=96.
Total Energy Use for 1 lane-mile of HMA pavement 0 Structure (inches) = HMA = Base = Subbase 12 24
LCAs are a defensible protocol for quantifying the energy, environmental and materials aspects of WMA. • Account for all processes associated with HMA • Include WMA additive production/transport • Include human health benefits beyond criteria pollutants • Isolate improvements attributable to WMA
But…there are issues with the way we do LCA. • Functional unit • describes the function and performance of the subject of the product or process being studied • Example: 1 lane-mile of pavement capable of supporting 100 million ESALs over 50 years Implies Structural design Traffic measurement Defining maintenance/rehabilitation methods Performance standard
And…we are missing a good chunk of the data we need to calculate a good LCA and it is expensive to get this data. GREET: Greenhouse Gases, Regulated Emissions, and Energy Use in Transportation Model from Argonne National Laboratories Eurobitume: LCI report for Eurobitume (European-type Asphalt Institute) EPA NONROAD: EPA emissions model for non-road vehicles EPA AP-42: EPA emissions factors (emissions tied to quantity of material)
12,500 tons ½-inch Superpave 0.25-ft mill-and-fill Right lane only
Grant County power mix. This is one of the cleanest mixes in the nation.
A few observations. • Mix temperature drives everything • We can gather less data and get same value • How to simplify • Report mix temperature • Temperature vs. criteria pollutants for types of plants • Temperature vs. vapor pressure for HMA compounds • Temperature vs. vapor pressure is NOT linear • The first 50°F is bigger than the second 50°F • Report burner performance • Report fuel usage
Summary • We have learned a lot about WMA • LCA can provide a defensible protocol for analyzing environmental/energy factors • Need to gather a few pieces of information to reduce the environmental data needed • HMA temperature vs. criteria pollutants • HMA temperature vs. asphalt fumes